Use Cause-and-Effect
Diagram to organize brainstorming information about the potential causes of a problem. Developing a cause-and-effect diagram with your team can help you compare the relative importance of different causes. A cause-and-effect diagram is also called a C&E diagram, a fishbone diagram, or an Ishikawa diagram.
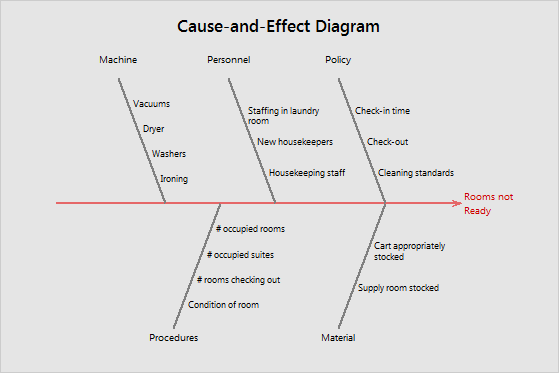
For example, a hotel manager wants to investigate why guest rooms are not ready for check-in at 4:00 PM. The manager brainstorms reasons with the improvement team and creates a cause-and-effect diagram to categorize the reasons. The team can then prioritize problem areas and develop improvement ideas.
Where to find this analysis
To create a cause-and-effect diagram, choose Stat > Quality Tools > Cause-and-Effect.
When to use an alternate analysis
If you want to identify which of the causes are most common, so that you can focus the improvement efforts, use Pareto Chart.