An engineer selects 10 parts that represent the expected range of the process variation. Three operators measure the 10 parts, three times per part, in a random order.
The engineer creates a gage run chart to assess the differences in measurements between different operators and parts.
- Open the sample data, GageData.MWX.
- Choose .
- In Part numbers, enter Part.
- In Operators, enter Operator.
- In Measurement data, enter Measurement.
- Click OK.
Interpret the results
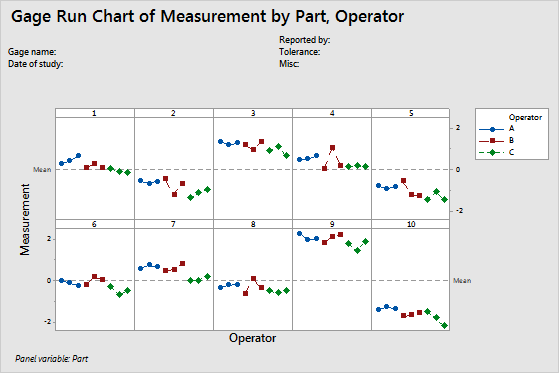
For each part, you can compare the variation between measurements that were made by each operator and examine the differences in measurements between operators. You can also view the measurements in relationship to the horizontal reference line. By default, the reference line is the mean of all the observations.
Most of the variation is due to differences between parts. Some smaller patterns also appear. For example, Operator B does not measure consistently, and Operator C usually measures lower than the other operators.