A supervisor at a small hospital wants to ensure that the number of errors in the hospital's medical records remains in control. The supervisor records the total number of medical records that are filed each day and the number of records that are incomplete or inaccurate (defectives).
The average subgroup size is more than 2500. Because of the large number of records, the supervisor uses a P chart diagnostic test to test for overdispersion.
- Open the sample data, DefectiveRecords.MWX.
- Choose .
- In Variables, enter Defectives.
- In Subgroup sizes, enter Total Records.
- Click OK.
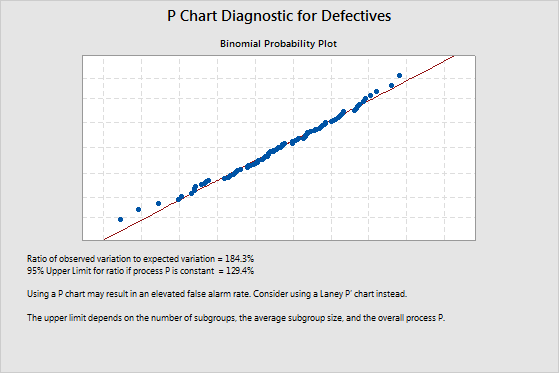
Interpret the results
The ratio of observed variation to expected variation is 184.3%. This value indicates overdispersion because it is greater than the upper confidence limit of 129.4%. Overdispersion can cause points on a traditional P chart to appear to be out of control when they are not. To adjust for overdispersion, the supervisor should use a Laney P' chart to monitor defective records instead of a traditional P chart.