The Weibull distribution is one of the most commonly used distributions to model nonnormal data. The Weibull distribution is described by the shape, scale, and threshold parameters. Depending on the values of these parameters, the Weibull distribution can take various shapes.
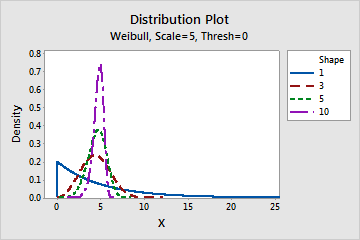
Effect of the shape parameter
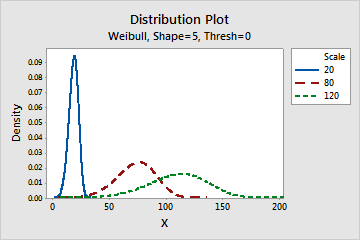
Effect of the scale parameter
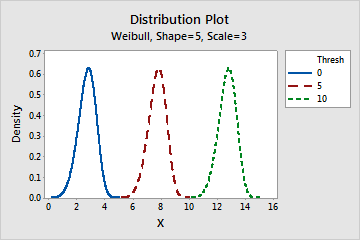
Effect of the threshold parameter
One of the main advantages of the Weibull distribution is that it can be similar to the characteristics of other types of distributions, making it very flexible in fitting different types of data. Examples of uses of the Weibull distribution in place of other distributions:
- The exponential distribution is a special case of Weibull distribution frequently used to study the scattering of radiation or wind speed.
- The Weibull distribution is an alternative to the normal distribution in the case of skewed data.
Other distributions for nonnormal capability analysis
Minitab also provides the following nonnormal distributions to model data for nonnormal capability analysis:
- Lognormal
- 3-parameter lognormal
- Exponential
- 2-parameter exponential
- Gamma
- 3-parameter gamma
- Logistic
- Loglogistic
- 3-parameter loglogistic
- Smallest extreme value
- Largest extreme value
To determine which distribution best fits your data, use your process knowledge and the results of a distribution fit test, such as Individual Distribution Identification.