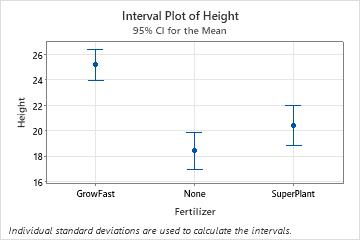
Use Interval Plot to assess and compare confidence intervals of the means of groups. An interval plot shows a 95% confidence interval for the mean of each group. An interval plot works best when the sample size is at least 10 for each group. Usually, the larger the sample size, the smaller and more precise the confidence interval.
For example, a scientist creates an interval plot to compare the confidence intervals for the heights of plants grown with different fertilizers.
Where to find this graph
To create an interval plot, choose one of the following: