About fitted distribution lines
A fitted distribution line is a theoretical distribution curve calculated using parameter estimates derived from a sample or from historical values that you enter. Use fitted distribution lines to determine how well sample data follow a specific distribution. These distribution lines are usually overlaid with the actual data so that you can directly compare the empirical data to the hypothesized distribution.
Examples of fitted distribution lines
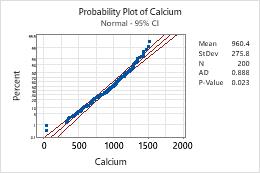
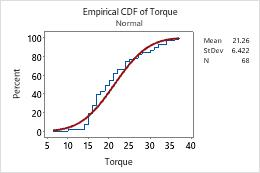
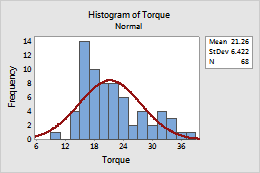
The following graphs include a fitted normal distribution line. Each graph table displays the parameter estimates used to generate the line or curve.
Add a distribution line when you create a graph
A normal fitted distribution line appears by default, for example, on probability plots and empirical CDF plots. You can specify a different distribution for these graphs, or you can add a fitted distribution line to other graphs, such as histograms, when you create a graph.
- In the dialog box for the graph you are creating, click Distribution or Data View.
- On the Distribution tab, choose a distribution and specify the parameters. For information about distributions and parameters, go to Distributions for fitted lines.
-
On the
Data
Display
tab, specify display options.
Note
On the Data Display tab for probability plots only, you can also specify the confidence level for the confidence interval. By default, confidence intervals show the 95% confidence bounds for the individual percentiles of the distribution. These intervals form the outer solid lines on the plot, and can be used to assess the precision of the individual percentile estimates. The confidence intervals should not be used to assess the distribution fit.
Add or remove a fitted distribution line on an existing probability plot or empirical CDF plot
- Double-click the graph.
- Right-click the graph and choose .
- In the Add Data Display dialog box, check or uncheck Distribution fit.
Add or remove a fitted distribution line on a histogram
- Double-click the graph.
- Right-click the graph and choose .
- In the Add Distribution Fit dialog box, choose a distribution and specify the parameters. For information about distributions and parameters, go to Distributions for fitted lines.
Edit a fitted distribution line
- Double-click the graph.
- Double-click the fitted distribution line.
-
Select the tab to make the edits that you want.
- Attributes: Change the color, size, or line type.
- Groups: Enter a categorical variable to visualize the groups.
- Options: Choose a distribution and specify the parameters. On probability plots only, you can also specify the confidence level for the confidence interval.
Tip
Hold the mouse pointer on the fitted distribution line to view a table of estimated percentiles. To copy the tooltip text, select the element that has the tooltip, then right-click and choose .