In This Topic
Mean
The mean is the sum of all observations divided by the number of (non-missing) observations. Use the following formula to calculate the mean for each cell or margin using the data corresponding to that cell or margin.
Formula

Notation
| Term | Description |
|---|---|
| x | data value for each observation |
| n | count of number of observations for each cell or margin |
Median
The median is the middle value in an ordered data set. Thus, at least half the observations are less than or equal to the median, and at least half the observations are greater than or equal to the median.
If the number of observations in a data set is odd, the median is the value in the middle. If the number of observations in a data set is even, the median is the average of the two middle values.
- N is odd
- For example, when N = 5, and you have ordered data (smallest value to largest value), x1, x2, x3, x4, and x5, then the median = x3.
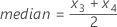
- N is even
- For example, when N = 6, and you have ordered data (smallest value to largest value), x1, x2, x3, x4, x5, and x6, then:
-
Minimum
The smallest data value that is in a table cell or margin.
Maximum
The largest data value that is in a table cell or margin.
Sum
The sum is the total of all the data values that are in a table cell or margin.
Sum = Σ x
Standard deviation
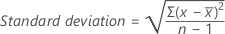
The standard deviation is the most common measure of dispersion, or how spread out the data are about the mean. The more widely the values are spread out, the larger the standard deviation. The standard deviation is calculated by taking the square root of the variance.
Formula
Use this formula to calculate the standard deviation for each cell or margin using the data from that cell or margin.
Notation
| Term | Description |
|---|---|
| x | data value for each observation |
 | mean for each cell or margin |
| n | count of number of observations for each cell or margin |
N Nonmissing
The number of non-missing observations that are in a table cell or margin.
N Missing
The number of missing observations that are in a table cell or margin.
Counts
Formula
The count is the number of times each combination of categories occurs.
Row percent
Formula
The row percent is obtained by multiplying the ratio of a cell count to the corresponding row total by 100 and is given by:

Notation
| Term | Description |
|---|---|
| n i+ | number of observations in the i th row |
| nij | number of observations in the cell corresponding to i th row and j th column |
Column percent
Formula
The column percent is obtained by multiplying the ratio of a cell count to the corresponding column total by 100 and is given by:

Notation
| Term | Description |
|---|---|
| n +j | counts of all the observations in the j th column |
| nij | counts of observations in the cell corresponding to i th row and j th column |
Total percents
Formula
The total percent is obtained by multiplying the ratio of a cell count to the total number of observations by 100 and is given by:

Notation
| Term | Description |
|---|---|
| n ++ | number of observations in the table |
| nij | number of observations in the cell corresponding to i th row and j th column |