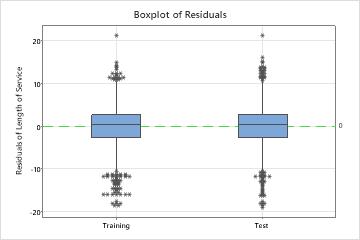
The boxplot shows the difference between the actual and fitted values. Points that are more than 1.5 times the interquartile range from the nearest quartile have individual symbols.
Interpretation
Ideally, the residuals are all close to 0, relative to the scale of the response variable. When you use a validation technique, Minitab creates separate plots for the training and test data. You can compare the plots to examine the relative performance of the tree on the training data and on new data. You can also look for different patterns that could indicate a difference to investigate between the training and test data.
These boxplots show similar results for a training and test data sets. This similarity suggests that the performance of the tree on new data is close to the performance of the tree on the training data.
The interquartile range of the boxplots for both data sets is from about –2.6 to 2.6. 50% of the data have residuals within this range. The remaining residuals are larger. Because the interquartile range is about 5, residuals that are outside the approximate range –10.5 to 10.5 have individual symbols. The largest residuals are near 20 in the positive and negative directions. These large residuals can indicate that the tree does not fit all of the data well.