Quality engineers want to improve a process that produces pretzels.
Color is a key
quality characteristic. The engineers use a definitive screening design to determine which
potential factors affect the color of the pretzels. For the experiment, inspectors quickly sort
small batches of pretzels into conforming and non-conforming
categories.
- Open the sample data, PretzelColor.MWX.
- Choose
- In Event
name, enter Event.
- In Number of
events, enter Passable Color.
- In Number of
trials, enter Trials.
- Click Terms.
- In Include the following terms, choose Full
quadratic. Click OK.
- Click Stepwise.
- In Method, choose Forward information
criteria.
- Click OK in each dialog box.
Interpret the results
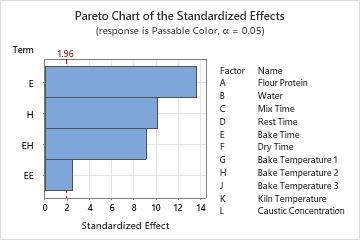
The Pareto chart shows bars for the terms from the best model according to the AICc criterion. Two main effects are in the model: Bake Time (E) and Bake Temperature 2 (H). The model also includes the square term for Bake Time and the interaction effect between the two factors.
The engineers agree that this model matches their process knowledge. The engineers decide to use
the model to plan further experimentation.
Syntax Error
Forward Selection of Terms
Achieved minimum AICc = 243.23
Response Information
| Passable Color | Event | 4235 | Event |
|---|
| | Non-event | 765 | |
|---|
| Trials | Total | 5000 | |
|---|
Coded Coefficients
| Constant | 2.394 | 0.145 | |
|---|
| Bake Time | 0.7349 | 0.0538 | 1.11 |
|---|
| Bake Temperature 2 | 0.5451 | 0.0541 | 1.20 |
|---|
| Bake Time*Bake Time | -0.384 | 0.153 | 1.04 |
|---|
| Bake Time*Bake Temperature 2 | -0.5106 | 0.0562 | 1.24 |
|---|
Odds Ratios for Continuous Predictors
| Bake Time | 2 | * | (*, *) |
|---|
| Bake Temperature 2 | 15 | * | (*, *) |
|---|
Model Summary
| 95.81% | 95.29% | 241.87 | 243.23 | 251.43 |
|---|
Goodness-of-Fit Tests
| Deviance | 45 | 32.28 | 0.922 |
|---|
| Pearson | 45 | 31.93 | 0.929 |
|---|
| Hosmer-Lemeshow | 8 | 7.10 | 0.526 |
|---|
Analysis of Variance
| Model | 4 | 737.452 | 184.363 | 737.45 | 0.000 |
|---|
| Bake Time | 1 | 203.236 | 203.236 | 203.24 | 0.000 |
|---|
| Bake Temperature 2 | 1 | 100.432 | 100.432 | 100.43 | 0.000 |
|---|
| Bake Time*Bake Time | 1 | 6.770 | 6.770 | 6.77 | 0.009 |
|---|
| Bake Time*Bake Temperature 2 | 1 | 80.605 | 80.605 | 80.61 | 0.000 |
|---|
| Error | 45 | 32.276 | 0.717 | | |
|---|
| Total | 49 | 769.728 | | | |
|---|
Regression Equation in Uncoded Units
| P(Event) | = | exp(Y')/(1 + exp(Y')) |
|---|
| Y' | = | -11.984 + 3.361 Bake Time + 0.08740 Bake Temperature 2 - 0.0961 Bake Time*Bake Time
- 0.01702 Bake Time*Bake Temperature 2 |
|---|
Fits and Diagnostics for Unusual Observations
| 1 | 0.9800 | 0.9376 | 2.0298 | 2.13 | R |
|---|
| 7 | 0.9800 | 0.9396 | 1.9581 | 2.00 | R |
|---|
| 24 | 0.9000 | 0.9497 | -2.0182 | -2.15 | R |
|---|