Method
Minitab uses two methods to analyze standard deviations of the repeat or replicate measurements: least squares and maximum likelihood. Both methods are based on a linear model with a log link function: ln(σ) = Aγ, where A is the design matrix and γ is a vector of parameters to be estimated. One advantage to using the log link function is the fitted values are always positive.
The two methods produce equivalent results in the saturated model, when the number of parameters equals the number of data points.
For the least squares estimation, Minitab uses weighted least squares regression. If the number of repeats or replicates is the same, the weights are equal.
For MLE, Minitab assumes that the original data come from a normal distribution. The distribution of the sample variance is related to the χ2 distribution.
Design matrix
Minitab uses the same approach to the design matrix as used in general linear model (GLM), which uses regression to fit the model you specify. First Minitab creates a design matrix from the factors and the model that you specify. The columns of this matrix, called X, represent the terms in the model.
The design matrix has n rows, where n = number of observations and several blocks of columns, corresponding to the terms in the model. The first block is for the constant and contains just one column, a column of all ones. The block for a continuous factor also contains just one column. The block of columns for a categorical factor contains r columns, where r = degrees of freedom for the factor.
For example, a fractional factorial design has three factors with 2 levels each. The model includes 3 main effects. Each row is coded as one of the following:
| Blocks | Factor 1 | Factor 2 | Factor 3 |
|---|---|---|---|
| 1 | −1 | −1 | −1 |
| 1 | 1 | −1 | −1 |
| 1 | −1 | 1 | −1 |
| 1 | 1 | 1 | −1 |
| 1 | −1 | −1 | 1 |
| 1 | 1 | −1 | 1 |
| 1 | −1 | 1 | 1 |
| 1 | 1 | 1 | 1 |
Effects
Estimated effects for each factor. Effects are only calculated for two-level models and are not calculated for general factorial models. The formula for the effect of a factor is:
Effect = Coefficient * 2
Coefficients (Coef)
The estimates of the population regression coefficients in a regression equation. For each factor, Minitab calculates k - 1 coefficients, where k is the number of levels in the factor. For a 2-factor, 2-level, full factorial model, the formulas for coefficients for the factors and interactions are:


The standard error of the coefficient for this 2-factor, 2-level, full factorial model is:

For information on models with more than two factors or factors with more than two levels, see Montgomery1.
Notation
| Term | Description |
|---|---|
 | mean of y at the high level of factor A |
 | overall mean of all observations |
 | mean of y at the high level of factor B |
 | mean of y at the high levels of A and B |
| MSE | mean square error |
| n | number of - 1's and 1's (in the covariance matrix) for the estimated term |
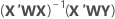
Weighted regression
Weighted least squares regression is a method for dealing with observations that have nonconstant variances. If the variances are not constant, observations with:
- large variances should be given relatively small weights
- small variances should be given relatively large weights
The weights reflect the number of repeats or replicates used to calculate each standard deviation. Standard deviations based on more data receive larger weights.
Notation
| Term | Description |
|---|---|
| X | design matrix |
| X' | transpose of the design matrix |
| W | an n x n matrix with the weights on the diagonal |
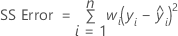
| Y | vector of log standard deviation values |
| n | number of observations |
| wi | weight for the ith observation |
| yi | log standard deviation value for the ith observation |
 | fitted value for the log standard deviation for the ith observation |
Calculating weights
You can calculate and store weights using fitted or adjusted variances based on dispersion model to use when analyzing the location model.
- 1 / fitted variance
- σ2(between) + σ2 (within) / number of repeats
"Between" and "within" refer to a run of the experiment. Variation within a run is what you measure with the standard deviation for repeat observations. Variation between runs refers to the additional sources of variation for new runs.
When you analyze the standard deviation across repeats, you are fitting a model to s (within). If you have replicates, Minitab combines the model for σ2 (within) and the variance of means across replicates to obtain an estimate of σ2 (between). Then, the estimate of σ2 (between) is recombined with σ2 (within) / number of repeats to get variance estimates for the means that are consistent with your dispersion model.
This approach assumes that σ2(between) is constant, and does not depend on the factor levels. If this assumption is incorrect, you may want to fit a model to the variance of x by using Preprocess responses with  to get σ2 across replicates.
If you have covariates in your model, you should account for them in the variance for repeats. You cannot account for covariates in the fitted variance.