A food scientist is studying factors that affect food spoilage. The scientist uses a 2-level factorial experiment to assess several factors that could impact the rate of food spoiling.
The scientist analyzes a 2-level factorial design to determine how preservative type, vacuum packaging pressure, contamination level, and cooling temperature affect the spoilage of fruit. The response is binary—whether spoilage is detected or not—in a sample of 500 containers of fruit.
- Open the sample data, FoodSpoilage.MWX.
- Choose .
- In Event name, enter Event.
- In Number of events, enter Spoilage.
- In Number of trials, enter Containers.
- Click Terms.
- Under Include terms in the model up through order, choose 2.
- Click OK in each dialog box.
Interpret the results
In the Deviance table, the p-values for three of the main effect terms—Preservative, VacuumPress, and ContaminationLevel—are significant. Because the p-values are less than the significance level of 0.05, the scientist concludes that these factors are statistically significant. None of the two-way interactions are significant. The scientist can consider reducing the model.
The Deviance R2 value shows that the model explains 97.95% of the total deviance in the response, which indicates that the model fits the data well.
Most of the VIFs are small, which indicates that the terms in the model are not correlated.
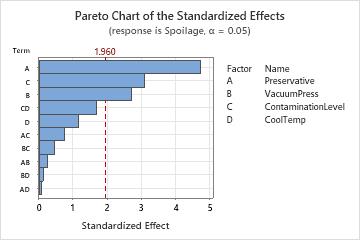
The Pareto plot of the effects allow you to visually identify the important effects and compare the relative magnitude of the various effects. In these results, three main effects are statistically significant (α = 0.05) - preservative type (A), vacuum seal pressure (B), and contamination level (C). In addition, you can see that the largest effect is preservative type (A) because it extends the farthest. The effect for the preservative by cooling temperature interaction (AD) is the smallest because it extends the least.
Method
| Link function | Logit |
|---|---|
| Rows used | 16 |
Response Information
| Variable | Value | Count | Event Name |
|---|---|---|---|
| Spoilage | Event | 506 | Event |
| Non-event | 7482 | ||
| Containers | Total | 7988 |
Coded Coefficients
| Term | Effect | Coef | SE Coef | VIF |
|---|---|---|---|---|
| Constant | -2.7370 | 0.0479 | ||
| Preservative | 0.4497 | 0.2249 | 0.0477 | 1.03 |
| VacuumPress | 0.2574 | 0.1287 | 0.0477 | 1.06 |
| ContaminationLevel | 0.2954 | 0.1477 | 0.0478 | 1.06 |
| CoolTemp | -0.1107 | -0.0554 | 0.0478 | 1.07 |
| Preservative*VacuumPress | -0.0233 | -0.0117 | 0.0473 | 1.05 |
| Preservative*ContaminationLevel | 0.0722 | 0.0361 | 0.0474 | 1.06 |
| Preservative*CoolTemp | 0.0067 | 0.0034 | 0.0472 | 1.05 |
| VacuumPress*ContaminationLevel | -0.0430 | -0.0215 | 0.0469 | 1.04 |
| VacuumPress*CoolTemp | -0.0115 | -0.0058 | 0.0465 | 1.02 |
| ContaminationLevel*CoolTemp | 0.1573 | 0.0786 | 0.0467 | 1.02 |
Odds Ratios for Continuous Predictors
| Unit of Change | Odds Ratio | 95% CI | |
|---|---|---|---|
| VacuumPress | 10.0 | * | (*, *) |
| ContaminationLevel | 22.5 | * | (*, *) |
| CoolTemp | 5.0 | * | (*, *) |
Odds Ratios for Categorical Predictors
| Level A | Level B | Odds Ratio | 95% CI |
|---|---|---|---|
| Preservative | |||
| Any level | Any level | * | (*, *) |
Model Summary
| Deviance R-Sq | Deviance R-Sq(adj) | AIC | AICc | BIC |
|---|---|---|---|---|
| 97.95% | 76.75% | 105.98 | 171.98 | 114.48 |
Goodness-of-Fit Tests
| Test | DF | Chi-Square | P-Value |
|---|---|---|---|
| Deviance | 5 | 0.97 | 0.965 |
| Pearson | 5 | 0.97 | 0.965 |
| Hosmer-Lemeshow | 6 | 0.10 | 1.000 |
Analysis of Variance
| Source | DF | Adj Dev | Adj Mean | Chi-Square | P-Value |
|---|---|---|---|---|---|
| Model | 10 | 46.2130 | 4.6213 | 46.21 | 0.000 |
| Preservative | 1 | 22.6835 | 22.6835 | 22.68 | 0.000 |
| VacuumPress | 1 | 7.3313 | 7.3313 | 7.33 | 0.007 |
| ContaminationLevel | 1 | 9.6209 | 9.6209 | 9.62 | 0.002 |
| CoolTemp | 1 | 1.3441 | 1.3441 | 1.34 | 0.246 |
| Preservative*VacuumPress | 1 | 0.0608 | 0.0608 | 0.06 | 0.805 |
| Preservative*ContaminationLevel | 1 | 0.5780 | 0.5780 | 0.58 | 0.447 |
| Preservative*CoolTemp | 1 | 0.0051 | 0.0051 | 0.01 | 0.943 |
| VacuumPress*ContaminationLevel | 1 | 0.2106 | 0.2106 | 0.21 | 0.646 |
| VacuumPress*CoolTemp | 1 | 0.0153 | 0.0153 | 0.02 | 0.902 |
| ContaminationLevel*CoolTemp | 1 | 2.8475 | 2.8475 | 2.85 | 0.092 |
| Error | 5 | 0.9674 | 0.1935 | ||
| Total | 15 | 47.1804 |
Regression Equation in Uncoded Units
| P(Event) | = | exp(Y')/(1 + exp(Y')) |
|---|
| Y' | = | -2.721 + 0.188 Preservative + 0.0172 VacuumPress - 0.00249 ContaminationLevel - 0.0286 CoolTemp - 0.00117 Preservative*VacuumPress + 0.00160 Preservative*ContaminationLevel + 0.00067 Preservative*CoolTemp - 0.000096 VacuumPress*ContaminationLevel - 0.000115 VacuumPress*CoolTemp + 0.000699 ContaminationLevel*CoolTemp |
|---|