In This Topic
Degrees of freedom (DF)
Formula
- DF (Factor) = r – 1
- DF Error = nT – r
- Total = nT – 1
Notation
| Term | Description |
|---|---|
| nT | total number of observations |
| r | number of factor levels |
Sum of Squares (SS)
Formula
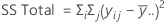
The sum of squared distances. SS Total is the total variation in the data. SS (Factor) is the deviation of the estimated factor level mean around the overall mean. It is also known as the sum of squares between treatments. SS Error is the deviation of an observation from its corresponding factor level mean. It is also known as error within treatments.
The calculations are:


Notation
| Term | Description |
|---|---|
| y̅i . | mean of the observations at the i th factor level |
| y̅.. | mean of all observations |
| yij | value of the j th observation at the i th factor level |
Mean squares (MS)
Formula
The calculation for the mean square for the factor follows:

The calculation for the mean square for error follows:

Notation
| Term | Description |
|---|---|
| MS | Mean Square |
| SS | Sum of Squares |
| DF | Degrees of Freedom |
F-value
Formula
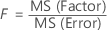
The degrees of freedom for the numerator are r – 1. The degrees of freedom for the denominator are nT – r.
Notation
| Term | Description |
|---|---|
| nT | total number of observations |
| r | number of factor levels |
P-value
Used in hypothesis tests to help you decide whether to reject or fail to reject a null hypothesis. The p-value is the probability of obtaining a test statistic that is at least as extreme as the actual calculated value, if the null hypothesis is true. A commonly used cut-off value for the p-value is 0.05. For example, if the calculated p-value of a test statistic is less than 0.05, you reject the null hypothesis.
S
An estimate of σ, the measure of the within-sample standard deviation. Note that S2 = MS Error. This is equivalent to the pooled standard deviation used in calculating the individual confidence intervals.
R-sq


R2 can also be calculated as the squared correlation of y and  .
.
Notation
| Term | Description |
|---|---|
| SS | Sum of Squares |
| y | response variable |
 | fitted response variable |
R-sq (adj)

Notation
| Term | Description |
|---|---|
| MS | Mean Square |
| SS | Sum of Squares |
| DF | Degrees of Freedom |
R-sq (pred)
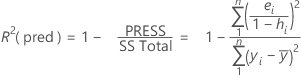
While the calculations for R2(pred) can produce negative values, Minitab displays zero for these cases.
Notation
| Term | Description |
|---|---|
| yi | i th observed response value |
 | mean response |
| n | number of observations |
| ei | i th residual |
| hi | i th diagonal element of X(X'X)–1X' |
| X | design matrix |