Wilk's test
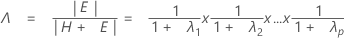
The test statistic, Wilks' lambda, is:
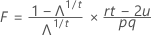
with pq and (rt – 2u) df.
Notation
| Term | Description |
|---|---|
| H | hypothesis matrix |
| E | error matrix |
| p | number of responses |
| q | df of the hypothesis |
| v | df for E |
| s | min (p, q) |
| m | .5 ( | p – q | – 1) |
| n | .5 (v – p – 1) |
| r | v – 0.5 (p – q + 1) |
| u | 0.25(pq – 2) |
| t | = Sqrt ([p2 q2 - 4] / p2 + q2 - 5, if p2 + q2 - 5 > 0 |
| t | 1 |
Let λ1≥λ2≥λ3≥ . . . ≥λp be the eigenvalues of (E** - 1) * H. The first three test statistics can be expressed in terms of either H and E or these eigenvalues.
The H matrix is a p x p matrix that contains the "between" sum of squares on the diagonal for each of the p variables. The H matrix is calculated as:

The E matrix is a p x p matrix that contains the "within" sum of squares on the diagonal for each of the p variables. The E matrix is calculated as:

In the first three tests, the F statistic is exact if s = 1 or 2, otherwise it is approximate. Minitab tells you when the test is approximate.
Lawley-Hotelling test
The test statistic, the Lawley-Hotelling trace, is:


with s (2m + s + 1) and 2 (sn + 1) df.
Notation
| Term | Description |
|---|---|
| H | hypothesis matrix |
| E | error matrix |
| p | number of responses |
| q | df of the hypothesis |
| v | df for E |
| s | min (p, q) |
| m | .5 ( | p – q | – 1) |
| n | .5 (v – p – 1) |
| r | v – 0.5 (p – q + 1) |
| u | 0.25(pq – 2) |
| t | = Sqrt ([p2 q2 - 4] / p2 + q2 - 5, if p2 + q2 - 5 > 0 |
| t | 1 |
Let λ1≥λ2≥λ3≥ . . . ≥λp be the eigenvalues of (E** - 1) * H. The first three test statistics can be expressed in terms of either H and E or these eigenvalues.
The H matrix is a p x p matrix that contains the "between" sum of squares on the diagonal for each of the p variables. The H matrix is calculated as:

The E matrix is a p x p matrix that contains the "within" sum of squares on the diagonal for each of the p variables. The E matrix is calculated as:

In the first three tests, the F statistic is exact if s = 1 or 2, otherwise it is approximate. Minitab tells you when the test is approximate.
Pillai's test
The test statistic, Pillai's trace, is:


Notation
| Term | Description |
|---|---|
| H | hypothesis matrix |
| E | error matrix |
| p | number of responses |
| q | df of the hypothesis |
| v | df for E |
| s | min (p, q) |
| m | .5 ( | p – q | – 1) |
| n | .5 (v – p – 1) |
| r | v – 0.5 (p – q + 1) |
| u | 0.25(pq – 2) |
| t | = Sqrt ([p2 q2 - 4] / p2 + q2 - 5, if p2 + q2 - 5 > 0 |
| t | 1 |
Let λ1≥λ2≥λ3≥ . . . ≥λp be the eigenvalues of (E** - 1) * H. The first three test statistics can be expressed in terms of either H and E or these eigenvalues.
The H matrix is a p x p matrix that contains the "between" sum of squares on the diagonal for each of the p variables. The H matrix is calculated as:

The E matrix is a p x p matrix that contains the "within" sum of squares on the diagonal for each of the p variables. The E matrix is calculated as:

In the first three tests, the F statistic is exact if s = 1 or 2, otherwise it is approximate. Minitab tells you when the test is approximate.
Roy's maximum root test
The largest eigenvalue, λ1. To finish the test, you must use special charts, called Heck charts, along with the parameters s, m, and n, to find the significance level.
See Heck1 for these charts.
Notation
| Term | Description |
|---|---|
| s | min (p, q) |
| m | .5 ( | p – q | – 1) |
| n | .5 (v – p – 1) |
Let λ1≥λ2≥λ3≥ . . . ≥λp be the eigenvalues of (E** - 1) * H. The first three test statistics can be expressed in terms of either H and E or these eigenvalues.
- D.L. Heck (1960), "Charts of Some Upper Percentage Points of the Distribution of the Largest Characteristic Root," The Annals of Statistics, 625–642.