A quality engineer wants to evaluate how consistently a radon detection device measures the amount of radon. The engineer measures the radon level twice a day for 20 days.
As an exploratory measure, the engineer constructs a run chart to look for evidence of nonrandom patterns in the radon measurements from the membrane devices.
- Open the sample data, RadonTime.MWX.
- Choose .
- In Single column, enter Radon Level.
- In Subgroup size, enter Day.
- Click OK.
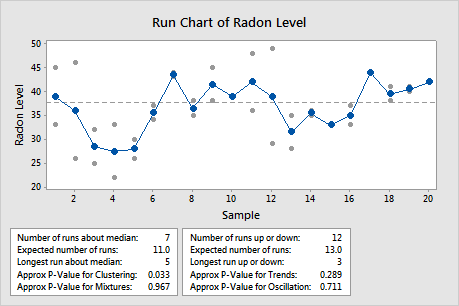
Interpret the results
In this example, the data appear to show some clustering as the radon levels stabilize, in subgroups 3 through 5. To determine whether this nonrandom pattern is statistically significant, the engineer examines the tests for runs about the median. The engineer also examines the tests for the runs up or down to look for other patterns in the data.
Because the p-value for the cluster test (p = 0.033) is less than the α value of 0.05, the engineer concludes that special causes affect the process. Clusters may indicate sampling or measurement problems, or they may be expected, as in this case, where the radon levels stabilize before increasing.