Use Individuals Chart to monitor the mean of your process when you have continuous data that are individual observations that are not in subgroups. Use this control chart to monitor process stability over time so that you can identify and correct instabilities in a process.
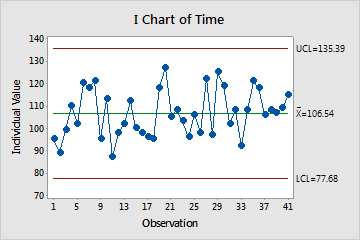
The points vary randomly around the center line and are within the control limits. No trends or patterns are present. The amount of time to perform hernia surgery in times are stable.
Note
The process variation must be in control before you assess the process center using an individuals chart because the control limits for the individuals chart are calculated using the within-subgroup variation. If the process variation is not stable, then the individuals chart control limits will be questionable and the chart might show a false out-of-control signal. Use a moving range chart to determine whether the process variation is in control.
Where to find this control chart
To create an individuals chart, choose .
When to use an alternate control chart
- If you can collect data in subgroups, use Xbar Chart.
- If your data are counts of defectives or defects, use an attribute control chart, such as P Chart or U Chart.