A sampling distribution describes the likelihood of obtaining each possible value of a statistic from a random sample of a population; in other words, what proportion of all random samples of that size will give that value. Bootstrapping is a method that estimates the sampling distribution by taking multiple samples with replacement from a single random sample. These repeated samples are called resamples. Each resample is the same size as the original sample.
The original sample represents the population from which it was drawn. Therefore, the resamples from this original sample represent what we would get if we took many samples from the population. The bootstrap distribution of a statistic, based on the resamples, represents the sampling distribution of the statistic.
For example, you want to estimate the sampling distribution of the proportion of blue M&M's. You open a random packet and determine that there are 102 M&M's, of which 23 (22.5%) are blue. Repeated sampling with replacement from this original sample mimics what the population might look like. To take a resample, an M&M is randomly selected from the original sample, the color is recorded, and the M&M is put back into the sample. This is done 102 times (the size of the original sample) to complete a single resample. The following bar chart represents a single bootstrap sample taken from the original sample.
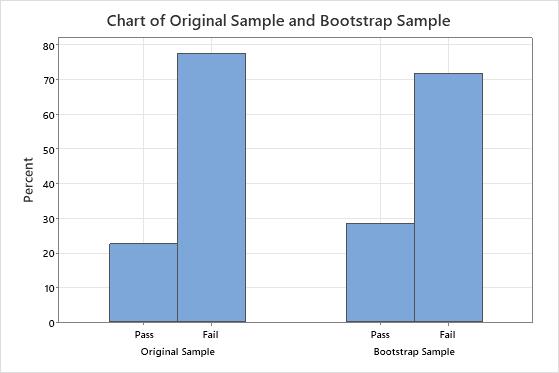
Because the resample is done by sampling with replacement, the bootstrap sample proportion will usually not exactly match the original proportion. This bar chart shows that the original sample found that approximately 22.5% of the M&M's were blue, while the bootstrap sample found that approximately 28.4% of the M&M's were blue. To create a bootstrap distribution, you take many resamples. The following histogram shows the bootstrap distribution for 1,000 resamples of the original packet of M&M's.
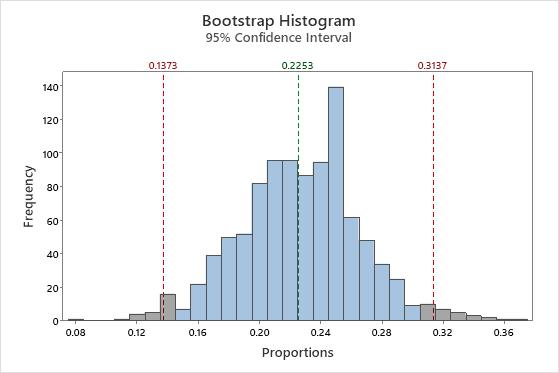
The bootstrap distribution is centered at approximately 22.5%, which is an estimate of the population proportion. The red reference lines represent a 95% confidence interval. The middle 95% of values from the bootstrapping distribution provide a 95% confidence interval for the population proportion of blue M&M's. In this example, you can be 95% confident the population proportion of blue M&M's is between approximately 13.7% and 31.4%.
Bootstrapping and the central limit theorem
The central limit theorem is a fundamental theorem of probability and statistics. The theorem states that the distribution of  , which is the mean of a random sample from a population with finite variance, is approximately normally distributed when the sample size is large, regardless of the shape of the population's distribution. Bootstrapping can be used to easily understand how the central limit theorem works. Consider data that comes from an exponential distribution.
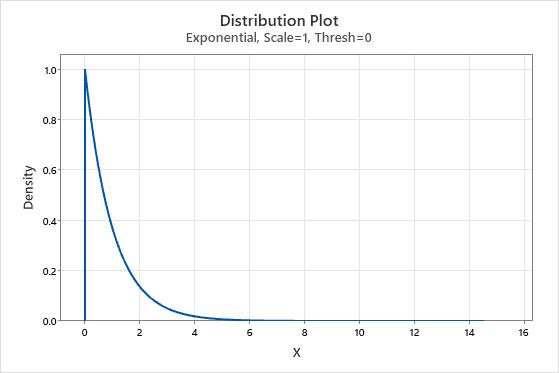
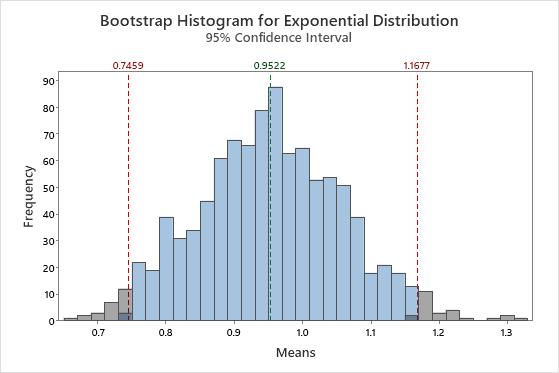
It is very obvious that the data are not normal. But now we'll take a sample of 50 observations and create a bootstrap distribution of the means of 10 resamples.
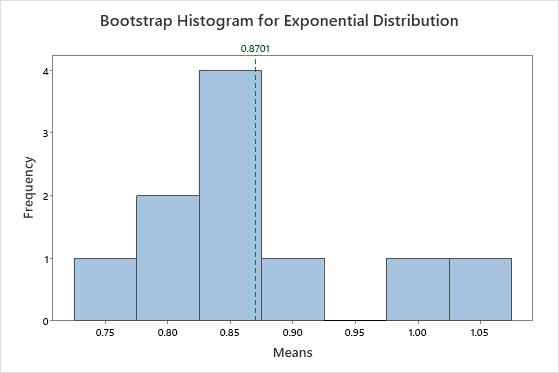
The distribution of the means is very different from the exponential distribution. It looks much closer to a normal distribution. This resemblance increases as the number of resamples increases. With 1,000 resamples, the distribution of the mean of the resamples is approximately normal.