In This Topic
Step 1: Examine the shape of your bootstrap distribution
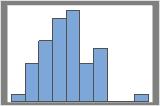
50 resamples
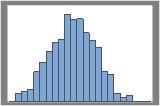
1000 resamples
The distribution is usually easier to determine with more resamples. For example, in these data, the distribution is ambiguous for 50 resamples. With 1000 resamples, the shape looks approximately normal.
In this histogram, the bootstrap distribution appears to be normal.
Step 2: Determine a confidence interval for the population mean
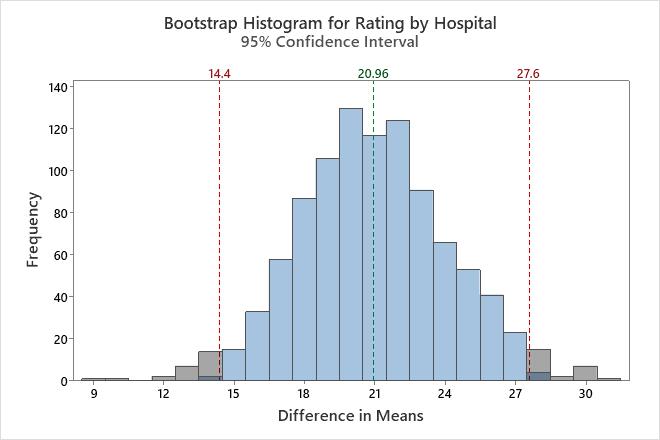
First, consider the difference in means from the bootstrap sample, and then examine the confidence interval.
The difference in means of the bootstrap sample is an estimate of the difference in population means. Because the difference of the bootstrap sample is based on sample data and not the entire population, it is unlikely that the difference of the bootstrap sample equals the difference in population means. To better estimate the difference in population means, use the confidence interval.
Confidence intervals are based on the sampling distribution of a statistic. If a statistic has no bias as an estimator of a parameter, its sampling distribution is centered at the true value of the parameter. A bootstrapping distribution approximates the sampling distribution of the statistic. Therefore, the middle 95% of values from the bootstrapping distribution provide a 95% confidence interval for the parameter. The confidence interval helps you assess the practical significance of your estimate for the population parameter. Use your specialized knowledge to determine whether the confidence interval includes values that have practical significance for your situation.
Note
Minitab does not calculate the confidence interval when the number of resamples is too small to obtain an accurate confidence interval.
Observed Samples
| Hospital | N | Mean | StDev | Variance | Minimum | Median | Maximum |
|---|---|---|---|---|---|---|---|
| A | 20 | 80.30 | 8.18 | 66.96 | 62.00 | 79.00 | 98.00 |
| B | 20 | 59.30 | 12.43 | 154.54 | 35.00 | 58.50 | 89.00 |
Difference in Observed Means
| Mean of A - Mean of B = 21 |
|---|
Bootstrap Samples for Difference in Means
| Number of Resamples | Average | StDev | 95% CI for Difference |
|---|---|---|---|
| 1000 | 20.960 | 3.279 | (14.400, 27.600) |
Key Results: Average, 95% CI for Difference
In these results, the estimate for the population difference is 20.96. You can be 95% confident that the population difference is between 14.4 and 27.6.