To create a multiple probability plot, complete the steps for the option that best describes your data.
Groups are defined by values in categorical variables
Complete the following steps if your groups are defined by values in a grouping variable, or unique combinations of values in multiple grouping variables.
- In Graph variables, enter the numeric or date/time column that you want to graph.
- In Categorical variables for grouping (0-3), enter up to three columns that define the groups.
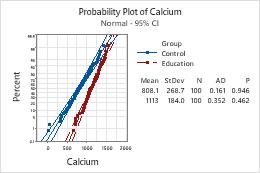
In this worksheet, Calcium is the graph variable and Group is the categorical variable for grouping. The graph shows the distribution of calcium amounts for the two groups.
| C1 | C2-T |
|---|---|
| Calcium | Group |
| 646.72 | Control |
| 1120.67 | Education |
| 1067.25 | Control |
| ... | ... |
Note
For information on how to specify different distributions and parameters, go to Fitted distribution lines.
Groups are graph variables
Complete the following steps if you have multiple numeric or date/time columns and each column is a group.
- In Graph variables, enter multiple numeric or date/time column that you want to graph.
- Select Graph variables form groups.
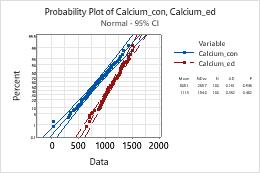
In this worksheet, Calcium_con and Calcium_ed are the graph variables. Each variable forms a group. The graph shows the distribution of calcium amounts for the two groups.
| C1 | C2 |
|---|---|
| Calcium_con | Calcium_ed |
| 646.72 | 1212.86 |
| 1120.67 | 1043.58 |
| 1067.25 | 1001.02 |
| ... | ... |
Note
For information on how to specify different distributions and parameters, go to Fitted distribution lines.