Use Probability Distribution Plot to view distribution curves that you specify. When you create a probability distribution plot, you specify one or more distributions and parameters so that you can visualize and compare distributions. You can also shade the area under the distribution curve to represent a value that you specify.
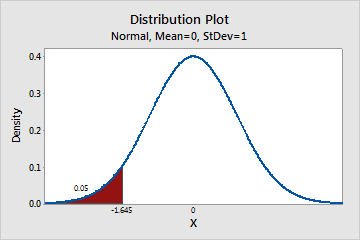
For example, the following probability distribution plot shows the x-value (−1.645) for the cumulative probability of 0.05 of a standard normal distribution.
Where to find this graph
To create a probability distribution plot, choose .