A statistician wants to see the relationship between the t-distribution and the standard normal distribution. The standard normal distribution is a normal distribution that has the parameters of the mean = 0 and the standard deviation = 1. The t-distribution is said to approximate the standard normal distribution as the number of degrees of freedom of the t-distribution increases.
- Choose .
- Select Two Distributions, then click OK.
- From Distribution 1, select t.
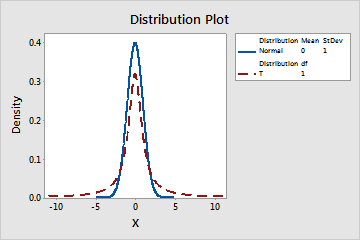
- In Degrees of freedom, enter 1.
- From Distribution 2, select Normal.
- In Mean, enter 0. In Standard deviation, enter 1.
- Click OK.
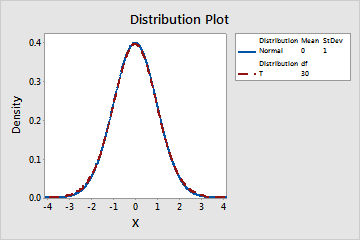
- Repeat steps 1–7, but in step 4, specify the t-distribution to have 30 degrees of freedom to create the second graph.
Interpret the results
With 1 degree of freedom, the t-distribution is similar in shape to the standard normal distribution; however, the t-distribution has larger tails. With 30 degrees of freedom, the t-distribution is approximately the same as the standard normal distribution.