Select an interval plot based on your data and how you want the plot to look.
One Y: Simple
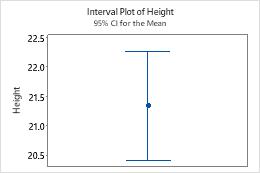
Create an interval plot that displays the confidence interval for the mean of one variable. The worksheet must include at least one column of numeric or date/time data.
For example, in the following worksheet, Height contains the numeric data. The graph shows the confidence interval for the mean of heights.
| C1 |
|---|
| Height |
| 22 |
| 26 |
| 19 |
| ... |
For more information, go to Create an interval plot of one Y variable.
One Y: With Groups
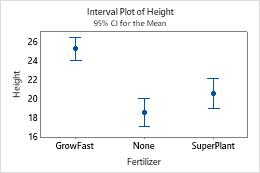
Create an interval plot that displays the confidence intervals for the means of different groups. The worksheet must include at least one column of numeric or date/time data and at least one column of categorical data. Groups are defined by values in the categorical variable, or by unique combinations of values in multiple categorical variables.
For example, in the following worksheet, Height contains the numeric data and Fertilizer contains the categorical data. The graph shows the confidence intervals for the means of each group.
| C1 | C2 -T |
|---|---|
| Height | Fertilizer |
| 22 | None |
| 26 | GrowFast |
| 19 | SuperPlant |
| ... | ... |
For more information, go to Create an interval plot of one Y variable with groups.
Multiple Y’s: Simple
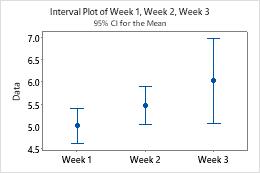
Create an interval plot that displays the confidence intervals for the mean of groups. The worksheet must include multiple columns of numeric or date/time data. Each column is a group.
For example, the following worksheet contains the fill weights for a food product each week for three weeks. Week 1, Week 2, and Week 3 contain the numeric data. The graph shows the confidence intervals for the means of the fill weights for each week.
| C1 | C2 | C3 |
|---|---|---|
| Week 1 | Week 2 | Week 3 |
| 5.03 | 5.71 | 5.73 |
| 5.19 | 5.37 | 5.32 |
| 4.98 | 5.26 | 6.25 |
| ... | ... | ... |
For more information, go to Create an interval plot of multiple Y variables.
Multiple Y’s: With Groups
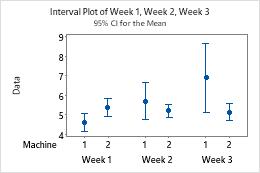
Create an interval plot that displays the confidence intervals for the means of multiple-level groups. Multiple-level groups are displayed as clustered confidence intervals. The worksheet must include multiple columns of numeric or date/time data and at least one column of categorical data. Groups are defined by separate columns and by values or unique combinations of values in categorical variables.
For example, the following worksheet contains the fill weights for a food product that was produced each week for three weeks, on two machines. Week 1, Week 2, and Week 3 contain the numeric data. Machine contains the categorical data. The graph shows the confidence intervals for the means of the fill weights for each machine, clustered by week.
| C1 | C2 | C3 | C4 |
|---|---|---|---|
| Week 1 | Week 2 | Week 3 | Machine |
| 5.03 | 5.71 | 5.73 | 1 |
| 5.19 | 5.37 | 5.32 | 2 |
| 4.98 | 5.26 | 6.25 | 1 |
| ... | ... | ... | ... |
For more information, go to Create an interval plot of multiple Y variables with groups.