Complete the following steps to specify the data for your graph.
- From Function, select the function of the graph variables that you want to graph.
- In Graph variables, enter multiple columns of numeric or date/time data that you want to graph.
- In Categorical variables for grouping (1-3, outermost first), enter up to four columns of categorical data that define groups. The first variable is the outermost on the scale and the last variable is the innermost.
- Select Stack values of last categorical variable to stack the multiple-level groups. If this option is not selected, Minitab displays the multiple-level groups as clustered bars.
- From Scale Level for Graph Variables, select one of the following:
- Graph variables displayed outermost on scale: Graph variables are the outermost groups and the categorical variables are the innermost groups. On the graph below, graph variables are outermost on the scale.
- Graph variables displayed innermost on scale: Graph variables are the innermost groups and the categorical variables are the outermost groups.
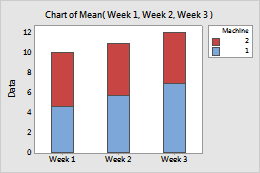
This worksheet contains the fill weights for a food product that was produced each week for three weeks, on two machines. Week 1, Week 2, and Week 3 are the graph variables, and Machine is the categorical variable. The graph shows the means of the fill weights produced each week, stacked by machine.
| C1 | C2 | C3 | C4 |
|---|---|---|---|
| Week 1 | Week 2 | Week 3 | Machine |
| 5.19 | 5.37 | 5.73 | 1 |
| 5.03 | 5.11 | 5.48 | 2 |
| 4.98 | 5.26 | 5.62 | 1 |
| ... | ... | ... | ... |