Use Make Mesh Data to create a grid of X and Y variables. You can also create a Z variable using a function. You can use these data to create contour plots and 3D surface plots.
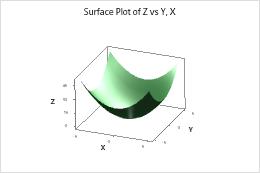
For example, a professor uses Make Mesh Data to create x- and y-values that form a mesh and the corresponding z-values for the bowl function. The professor creates a 3D surface plot of the X, Y, and Z data.
| C1 | C2 | C3 |
|---|---|---|
| X | Y | Z |
| −5 | −5 | 50 |
| −4 | −5 | 41 |
| −3 | −5 | 34 |
| ... | ... | ... |
Where to find this command
To create mesh data, choose .