Pairwise averages
Formula
 = all pairwise averages for i ≤ j.
 = the total number of pairwise averages
Notation
| Term | Description |
|---|---|
| Yi | ith value in the data set |
| Yj | jth value in the data set |
| n | sample size |
Estimated median
- D.B. Johnson and T. Mizoguchi (1978). "Selecting the Kth Element in X + Y and X1 + X2 + ... + Xm," SIAM Journal of Computing 7, pp.147-153.
Wilcoxon statistic
The Wilcoxon statistic is the number of pairwise averages (also called Walsh averages) that are larger than the hypothesized median, plus one half the number of pairwise averages that are equal to the hypothesized median. The Wilcoxon statistic is denoted as W. Minitab obtains the test statistic using an algorithm based on Johnson and Miizoguchi (1978)1.
- D.B. Johnson and T. Mizoguchi (1978). "Selecting the Kth Element in X + Y and X1 + X2 + ... + Xm," SIAM Journal of Computing 7, 147-153.
P-value
The Wilcoxon test statistic, W, is the sum of the ranks associated with the observations that exceed the hypothesized median. Minitab calculates the test statistic by using pairwise (Walsh) averages as described in Johnson and Mizoguchi1:
- The number of observations, N, is reduced by one for each observation that is equal to the hypothesized median. The sample size that results is n.
- Exclude observations that are equal to the hypothesized median. Calculate n(n + 1) / 2 pairwise Walsh averages (Yi + Yj) / 2 for i ≤ j of the observations.
For large sample sizes, the distribution of W is approximately normal. Specifically:
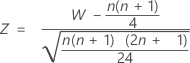 is approximately distributed as a normal distribution with a mean of 0 and a standard deviation of 1, N(0,1).
| Alternative hypothesis | P-value |
|---|---|
| H1: Median > Hypothesized median | 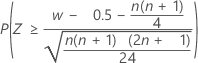 |
| H1: Median < Hypothesized median | 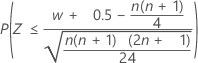 |
| H1: Median ≠ Hypothesized median | 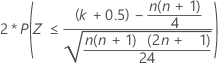 |
Notation
| Term | Description |
|---|---|
| n | the observed number of data points after the observations that are equal to the hypothesized median value are omitted |
| W | the Wilcoxon test statistic |
| w | the number of Walsh averages that exceed the hypothesized median, plus half of the number of Walsh averages that equal the hypothesized median. |
| k |  |
- D.B. Johnson and T. Mizoguchi (1978). "Selecting the Kth Element in X + Y and X1 + X2 + ... + Xm," SIAM Journal of Computing 7, pp.147-153.
Confidence interval
The confidence interval is the set of values (d) for which the test of H0: median = d is not rejected in favor of H1: median ≠ d, using the confidence level (α = 1 - (percent confidence) / 100). The 1-sample Wilcoxon test does not always achieve the confidence level that you specify because the Wilcoxon statistic is discrete. Because of this, Minitab uses a normal approximation with a continuity correction to calculate the closest achievable confidence level.