In binary logistic regression, you can enter data in two different formats: Binary Response/Frequency format and Event/Trial format. The trustworthiness and interpretation of some statistics in the output depend on the format of the data. For more information on when to use each data format, go to When to use each data format in binary logistic regression.
The effect of data format on the interpretation of deviance R2 and adjusted deviance R2
For binary logistic regression, the format of the data affects how you interpret the deviance R2 and the adjusted deviance R2 values. In Event/Trial format, each observed value represents the probability of the event for all the trials in that row of the data. Usually, this probability is for many trials and is between 0 and 1. In contrast, each observation in Binary Response/Frequency format usually represents only 1 trial. The observed value for a single trial is either 1 or 0.
In general, the difference in the data formats makes the total deviance in the data different. For Event/Trial data, the deviance relates to the discrepancy between the predicted probabilities and the observed probabilities. For Binary Response/Frequency format, the deviance relates to the discrepancy between the predicted probabilities and the outcome of 0% or 100% for each trial. The deviance R2 and the adjusted deviance R2 are usually higher for data in Event/Trial format.
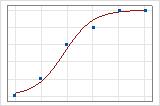
A graphical illustration clarifies the difference. In these plots, symbols represent the observations in the data and the curve represents the predicted values in the model. For Event/Trial data, the symbols fall close to the line. The deviance R2 value for the Event/Trial data is about 96%. The model predicts the average probabilities very well.
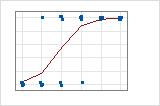
For the Binary Response/Frequency data, the observations are close to the predicted line only when the line is close to 0% or 100%. The deviance R2 value for the Binary Response/Frequency data is about 56%. The relationship between the predicted probabilities and the individual cases is not as strong.
Why the deviance goodness-of-fit test can be misleading for binary response/frequency data
For binary logistic regression, the format of the data affects whether the deviance goodness-of-fit tests is trustworthy. The p-value for the deviance goodness-of-fit test usually decreases as the number of trials per row decreases. Data in the Binary Response/Frequency format usually have few trials per row. Thus, the deviance goodness-of-fit test is likely to indicate a poor fit when the data are in Binary Response/Frequency format even when the fit is good. The deviance goodness-of-fit test is also likely to falsely indicate a poor fit when the data are in Event/Trial format but the number of trials per row is small.
The Hosmer-Lemeshow test does not depend on the format of the data. When the data have few trials per row, the Hosmer-Lemeshow test is a more trustworthy indicator of how well the model fits the data.
Compare these two sets of results for the same data in different formats. For these data, the form of the model is correct. The response information, coefficients, and the results of the Hosmer-Lemeshow test are the same. The conclusion for the deviance goodness-of-fit test depends on the data format.
In these results, the data are in the Binary Response/Frequency format with no frequency column. The analysis uses 500 rows of data. Each row represents 1 trial. At the 0.05 level of significance, the p-value for the deviance goodness-of-fit test indicates that the model fits poorly. This p-value leads to the incorrect conclusion that the model format is incorrect. If you collect data in the Binary Response/Frequency format, the deviance goodness-of-fit test is often not trustworthy.
Binary Logistic Regression: Y versus X
In these results, the data are in the Event/Trial format. The analysis uses 5 rows of data. Each row of the data represents 100 trials. At the 0.05 level of significance, the p-value for the deviance goodness-of-fit test does not find evidence of a poorly-fitting model. If you collect data in Event/Trial format, the deviance goodness-of-fit test is usually trustworthy.
Binary Logistic Regression: Event versus X
Why the Pearson goodness-of-fit test can be misleading for binary response/frequency data
For binary logistic regression, the format of the data affects whether the Pearson goodness-of-fit tests is trustworthy. The approximation to the chi-square distribution that the Pearson test uses is inaccurate when the expected number of events per row is small. Data in the Binary Response/Frequency format usually have few trials per row. Thus, the Pearson goodness-of-fit test is likely to be inaccurate when the data are in Binary Response/Frequency format.
The Hosmer-Lemeshow test does not depend on the format of the data. When the data have few trials per row, the Hosmer-Lemeshow test is a more trustworthy indicator of how well the model fits the data.
Compare these two sets of results for the same data in different formats. For these data, the form of the model is incorrect. The true model contains the interaction between X1 and X2. The response information, coefficients, and the results of the Hosmer-Lemeshow test are the same. The conclusion for the Pearson goodness-of-fit test depends on the data format.
In these results, the data are in the Binary Response/Frequency format with a frequency column. The analysis uses 18 rows of data. Each row represents 250 Bernoulli trials. At the 0.05 level of significance, the p-value for the Pearson goodness-of-fit test indicates that the model fits the data. This p-value leads to the incorrect conclusion that the model is adequate. If you collect data in the Binary Response/Frequency format, the Pearson goodness-of-fit test is not trustworthy.
Binary Logistic Regression: Y versus X1, X2
In these results, the data are in the Event/Trial format. The analysis uses 9 rows of data. Each row of the data represents 500 trials. At the 0.05 level of significance, the p-value for the Pearson goodness-of-fit test does indicates that the model does not fit the data. If you collect data in Event/Trial format, the Pearson goodness-of-fit test is usually trustworthy.