In This Topic
Deviance R-Sq
Deviance R2 is usually considered the proportion of the total deviance in the response variable that the model explains.
Interpretation
The higher the deviance R2, the better the model fits your data. Deviance R2 is always between 0% and 100%.
Deviance R2 always increases when you add additional terms to a model. For example, the best 5-term model will always have an R2 that is at least as high as the best 4-term model. Therefore, deviance R2 is most useful when you compare models of the same size.
Goodness-of-fit statistics are just one measure of how well the model fits the data. Even when a model has a desirable value, you should check the residual plots and goodness-of-fit tests to assess how well a model fits the data.
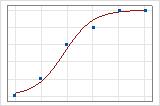
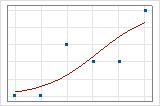
You can use a fitted line plot to graphically illustrate different deviance R2 values. The first plot illustrates a model that explains approximately 96% of the deviance in the response. The second plot illustrates a model that explains about 60% of the deviance in the response. The more deviance that a model explains, the closer the data points fall to the curve. Theoretically, if a model could explain 100% of the deviance, the fitted values would always equal the observed values and all of the data points would fall on the curve.
The data arrangement affects the deviance R2 value. The deviance R2 is usually higher for data with multiple trials per row than for data with a single trial per row. Deviance R2 values are comparable only between models that use the same data format. For more information, go to How data formats affect goodness-of-fit in binary logistic regression.
Deviance R-Sq (adj)
Adjusted deviance R2 is the proportion of deviance in the response that is explained by the model, adjusted for the number of predictors in the model relative to the number of observations.
Interpretation
Use adjusted deviance R2 to compare models that have different numbers of terms. Deviance R2 always increases when you add a term to the model. The adjusted deviance R2 value incorporates the number of terms in the model to help you choose the correct model.
| Step | % Potato | Cooling rate | Cooking temp | Deviance R2 | Adjusted Deviance R2 | P-value |
|---|---|---|---|---|---|---|
| 1 | X | 52% | 51% | 0.000 | ||
| 2 | X | X | 63% | 62% | 0.000 | |
| 3 | X | X | X | 65% | 62% | 0.000 |
The first step yields a statistically significant regression model. The second step, which adds cooling rate to the model, increases the adjusted deviance R2, which indicates that cooling rate improves the model. The third step, which adds cooking temperature to the model, increases the deviance R2 but not the adjusted deviance R2. These results indicate that cooking temperature does not improve the model. Based on these results, you consider removing cooking temperature from the model.
The data arrangement affects the adjusted deviance R2 value. For the same data, the adjusted deviance R2 is usually higher for data with multiple trials per row than for data with a single trial per row. Use the adjusted deviance R2 only to compare the fit of models that have the same data format. For more information, go to How data formats affect goodness-of-fit in binary logistic regression.
Test Deviance R-Sq
Interpretation
Use test deviance R2 to determine how well your model fits new data. Models that have larger test deviance R2 values tend to perform better on new data. You can use test deviance R2 to compare the performance of different models.
A test deviance R2 that is substantially less than deviance R2 may indicate that the model is over-fit. An over-fit model occurs when you add terms for effects that are not important in the population. The model becomes tailored to the training data and, therefore, may not be useful for making predictions about the population.
For example, an analyst at a financial consulting company develops a model to predict future market conditions. The model looks promising because it has an R2 of 87%. However, the test deviance R2 is 52%, which indicates that the model may be over-fit.
A high test deviance R2 value by itself does not indicate that the model meets the model assumptions. You should check the residual plots to verify the assumptions.
K-Fold Deviance R-sq
K-fold deviance R2 is usually considered the proportion of the total deviance in the response variable of the validation data that the model explains.
Interpretation
Use k-fold deviance R2 to determine how well your model fits new data. Models that have larger k-fold deviance R2 values tend to perform better on new data. You can use k-fold deviance R2 values to compare the performance of different models.
A k-fold deviance R2 that is substantially less than deviance R2 can indicate that the model is over-fit. An over-fit model occurs when you add terms for effects that are not important in the population. The model becomes tailored to the training data set and, therefore, might not be useful for making predictions about the population.
For example, an analyst at a financial consulting company develops a model to predict future market conditions. The model looks promising because it has a deviance R2 of 87%. However, the k-fold deviance R2 is 52%, which indicates that the model might be over-fit.
A high k-fold deviance R2 value by itself does not indicate that the model meets the model assumptions. You should check the residual plots to verify the assumptions.
AIC, AICc and BIC
The Akaike's Information Criterion (AIC), corrected Akaike’s Information Criterion (AICc), and the Bayesian Information Criterion (BIC) are measures of the relative quality of a model that account for fit and the number of terms in the model.
Interpretation
- AICc and AIC
- When the sample size is small relative to the parameters in the model, AICc performs better than AIC. AICc performs better because with relatively small sample sizes, AIC tends to be small for models with too many parameters. Usually, the two statistics give similar results when the sample size is large enough relative to the parameters in the model.
- AICc and BIC
- Both AICc and BIC assess the likelihood of the model and then apply a penalty for adding terms to the model. The penalty reduces the tendency to overfit the model to the sample data. This reduction can yield a model that performs better in general.
Area Under ROC Curve
The ROC curve plots the true positive rate (TPR), also known as power, on the y-axis, and the false positive rate (FPR), also known as type 1 error, on the x-axis. The different points represent different threshold values for the probability that a case is an event. The area under an ROC curve indicates whether the binary model is a good classifier.
When the analysis uses a validation method, Minitab calculates two ROC curves, one for the training data and one for the validation data. If the validation method is a test data set, then Minitab displays the test area under the ROC curve. If the validation method is cross-validation, then Minitab displays the k-fold area under the ROC curve. For example, for cross-validation with 10 folds, Minitab displays the 10-fold area under the ROC curve.
Interpretation
The area under the ROC curve values typically range from 0.5 to 1. When the binary model can perfectly separate the classes, then the area under the curve is 1. When the binary model cannot separate the classes better than a random assignment, then the area under the curve is 0.5.
When the analysis uses a validation method, use the area under the ROC curve for the validation method to determine whether the model can adequately predict the response values for new observations, or properly summarize the relationships between the response and the predictor variables. The training results are usually more ideal than actual and are for reference only.
If the area under the ROC curve for the validation method is substantially less than the area under the ROC curve, the difference can indicate that the model is over-fit. An over-fit model occurs when the model includes terms that are not important in the population. The model becomes tailored to the training data and, therefore, might not be useful for making predictions about the population.
Model Summary
| Deviance R-Sq | Deviance R-Sq(adj) | AIC | AICc | BIC | Area Under ROC Curve | 10-fold Deviance R-Sq | 10-fold Area Under ROC Curve |
|---|---|---|---|---|---|---|---|
| 50.86% | 42.43% | 276.02 | 286.11 | 409.48 | 0.9282 | 17.29% | 0.8519 |
These results show the model summary table for an over-fit model. The area under the ROC curve for the training data gives a more optimistic value for how well the model fits new data than the 10-fold area under the ROC Curve.