Relative variable importance standardizes the importance values for ease of interpretation. Relative importance is defined as the percent improvement with respect to the most important predictor.
An important variable is a variable that is used as a primary or surrogate splitter in the tree. The variable with the highest improvement score is set as the most important variable, and the other variables are ranked accordingly. Relative variable importance standardizes the importance values for ease of interpretation. Relative importance is defined as the percent improvement with respect to the most important predictor.
Relative importance is calculated by dividing each variable importance score by the largest importance score of the variables, then you multiply by 100%.
Interpretation
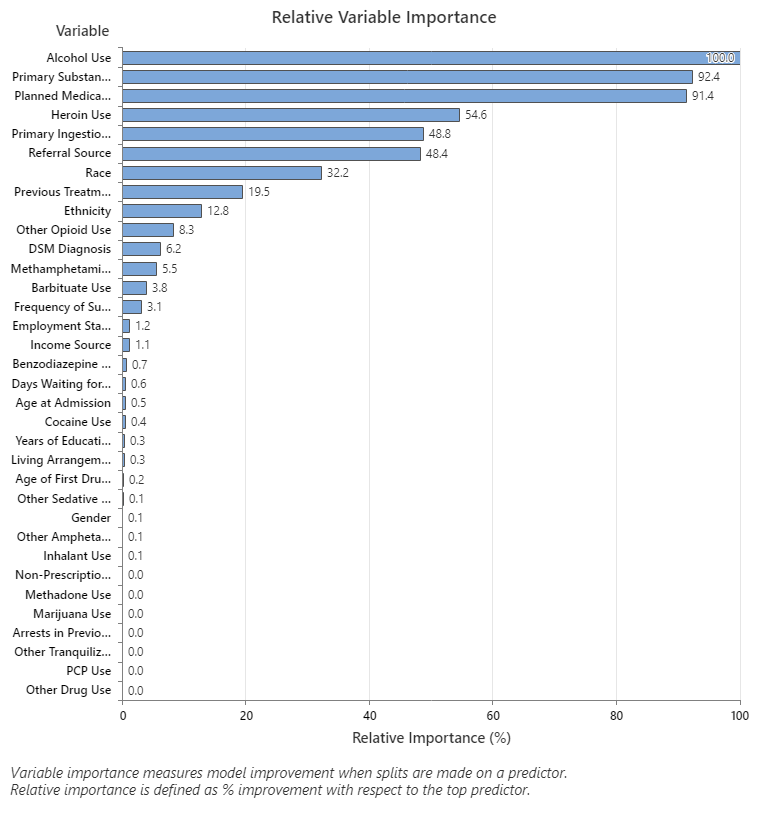
- Primary Substance of Abuse and Planned Medication Therapy are about 92% as important as Alcohol Use.
- Heroin Use is about 55% as important as Alcohol Use.
- Primary Ingestion Route of Sub and Referral Source are about 48% as important as Alcohol Use.
Although these results include 33 variables with positive importance, the relative rankings provide information about how many variables to control or monitor for a certain application. Steep drops in the relative importance values from one variable to the next variable can guide decisions about which variables to control or monitor. For example, in these data, the three most important variables have importance values that are relatively close together before a drop of almost 40% in relative importance to the next variable. Similarly, three variables have similar importance values near 50%. You can remove variables from different groups and redo the analysis to evaluate how variables in various groups affect the prediction accuracy values in the model summary table.