Total predictors
The number of total predictors available for the tree. This is the sum of the continuous predictors and the categorical predictors that you specify.
Important predictors
The number of important predictors in the tree. Important predictors are the variables that are used as primary or surrogate splitters.
Interpretation
You can use the Relative Variable Importance plot to display the order of relative variable importance. For instance, suppose 10 of 20 predictors are important in the tree, the Relative Variable Importance plot displays the variables in importance order.
Number of terminal nodes
A terminal node is a final node that cannot be split further.
Interpretation
You can use terminal node information to make predictions.
Minimum terminal node size
The minimum terminal node size is the terminal node with the smallest number of cases.
Interpretation
By default, Minitab sets the minimum number of cases allowed for a terminal node as 3 cases; however, the minimum terminal node size in a tree can be larger than the minimum number that the analysis allows. You can change this threshold value in the Options subdialog box.
R-squared
R2 is the percentage of variation in the response that the model explains. Outliers have a greater effect on R2 than on MAD and MAPE.
When you use a validation method, the table includes an R2 statistic for the training data set and an R2 statistic for the test data set. When the validation method is k-fold cross-validation, the test data set is each fold when the tree building excludes that fold. The test R2 statistic is typically a better measure of how the model works for new data.
Interpretation
Use R2 to determine how well the model fits your data. The higher the R2 value, the better the model fits your data. R2 is always between 0% and 100%.
A test R2 that is substantially less than the training R2 indicates that the tree might not predict the response values for new cases as well as the tree fits the current data set.
Root mean square error (RMSE)
The root mean square error (RMSE) measures the accuracy of the tree. Outliers have a greater effect on RMSE than on MAD and MAPE.
When you use a validation method, the table includes an RMSE statistic for the training data set and an RMSE statistic for the test data set. When the validation method is k-fold cross-validation, the test data set is each fold when the tree building excludes that fold. The test RMSE statistic is typically a better measure of how the model works for new data.
Interpretation
Use to compare the fits of different trees. Smaller values indicate a better fit. A test RMSE that is substantially more than the training RMSE indicates that the tree might not predict the response values for new cases as well as the tree fits the current data set.
Mean squared error (MSE)
The mean square error (MSE) measures the accuracy of the tree. Outliers have a greater effect on MSE than on MAD and MAPE.
When you use a validation method, the table includes an MSE statistic for the training data set and an MSE statistic for the test data set. When the validation method is k-fold cross-validation, the test data set is each fold when the tree building excludes that fold. The test MSE statistic is typically a better measure of how the model works for new data.
Interpretation
Use to compare the fits of different trees. Smaller values indicate a better fit. A test MSE that is substantially more than the training MSE indicates that the tree might not predict the response values for new cases as well as the tree fits the current data set.
Mean absolute deviation (MAD)
The mean absolute deviation (MAD) expresses accuracy in the same units as the data, which helps conceptualize the amount of error. Outliers have less of an effect on MAD than on R2, RMSE, and MSE.
When you use a validation method, the table includes an MAD statistic for the training data set and an MAD statistic for the test data set. When the validation method is k-fold cross-validation, the test data set is each fold when the tree building excludes that fold. The test MAD statistic is typically a better measure of how the model works for new data.
Interpretation
Use to compare the fits of different trees. Smaller values indicate a better fit. A test MAD that is substantially more than the training MAD indicates that the tree might not predict the response values for new cases as well as the tree fits the current data set.
Mean absolute percent error (MAPE)
The mean absolute percent error (MAPE) expresses accuracy as a percentage of the error. Because the MAPE is a percentage, it can be easier to understand than the other accuracy measure statistics. For example, if the MAPE, on average, is 0.05, then the average ratio between the fitted error and the actual value across all cases is 5%. Outliers have less of an effect on MAPE than on R2, RMSE, and MSE.
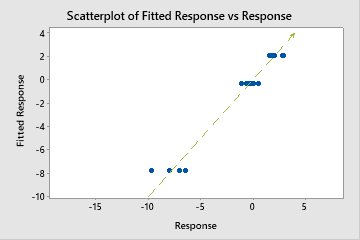
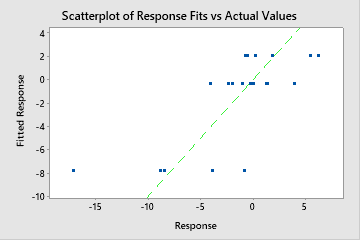
However, sometimes you may see a very large MAPE value even though the tree appears to fit the data well. Examine the fitted vs actual response value plot to see if any data values are close to 0. Because MAPE divides the absolute error by the actual data, values close to 0 can greatly inflate the MAPE.
When you use a validation method, the table includes an MAPE statistic for the training data set and an MAPE statistic for the test data set. When the validation method is k-fold cross-validation, the test data set is each fold when the tree building excludes that fold. The test MAPE statistic is typically a better measure of how the model works for new data.
Interpretation
Use to compare the fits of different trees. Smaller values indicate a better fit. A test MAPE that is substantially more than the training MAPE indicates that the tree might not predict the response values for new cases as well as the tree fits the current data set.