Use Variability
Chart as a preliminary tool to investigate variation in your data, including cyclical variations and interactions between factors. The variability charts show the relationships between factors and responses. Each chart displays up to eight factors.
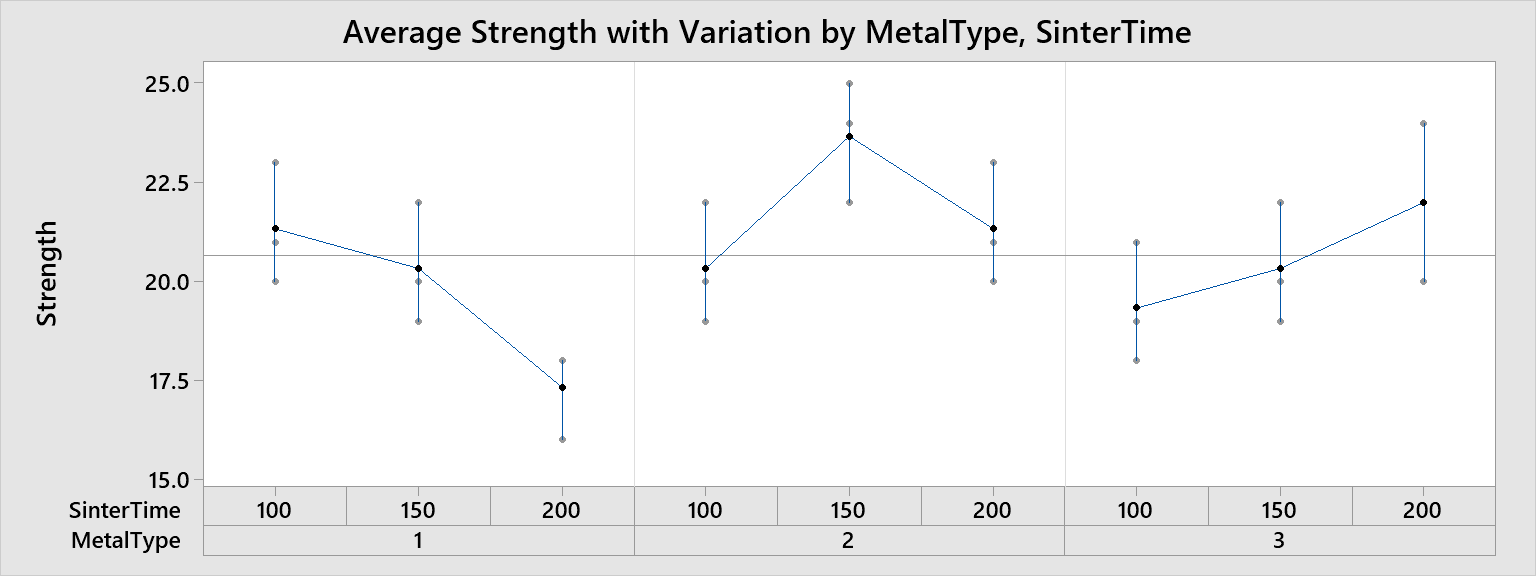
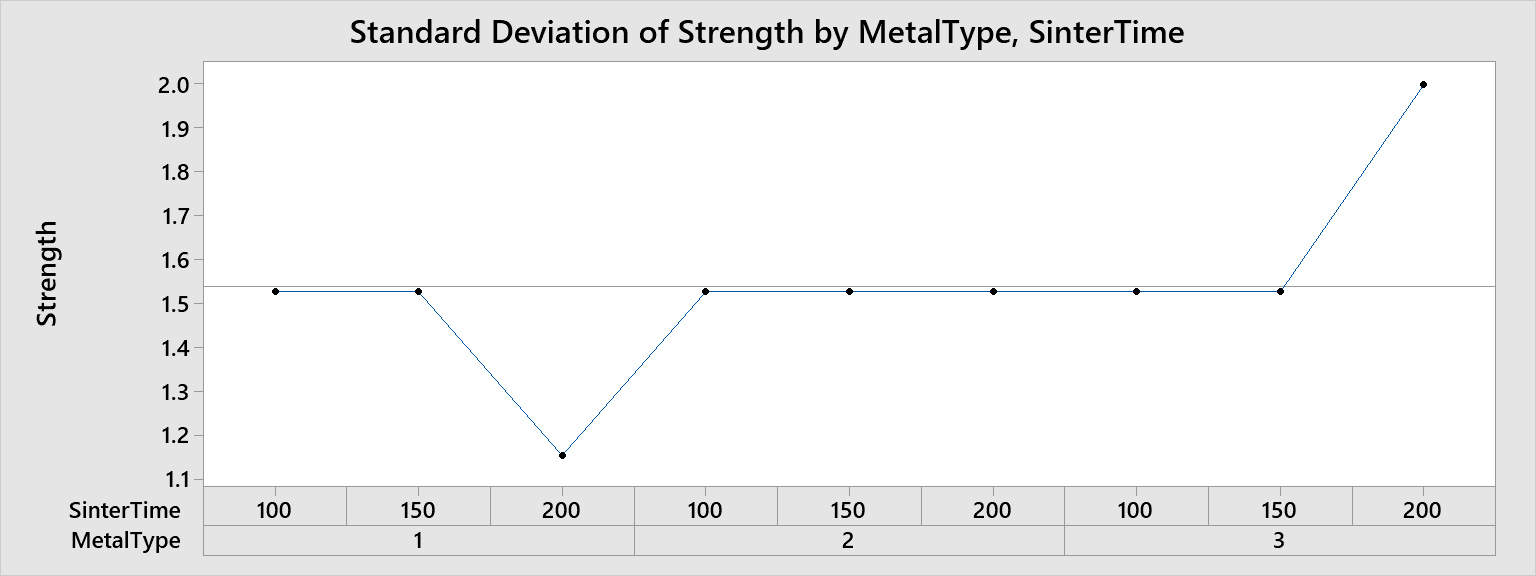
Two variability charts are available.
The average response with variation chart
The standard deviation chart
Where to find this analysis
To create variability charts, choose Stat > Quality Tools > Variability
Chart.
When to use an alternate analysis
To test the statistical significance of the factors or the interactions, you can use an ANOVA (analysis of variance) or a regression analysis.