A manufacturer wants to evaluate the variability of their paper bleaching process. The manufacturer randomly collects 200 samples of pulp and records the brightness level. The manufacturer wants to calculate a range within which the brightness of at least 99% of the batches of pulp are expected to fall.
- Open the sample data, PulpBrightness.MWX.
- Choose .
- In Variables enter Brightness.
- In Minimum percentage of population interval, enter 99.
- Click OK.
Interpret the results
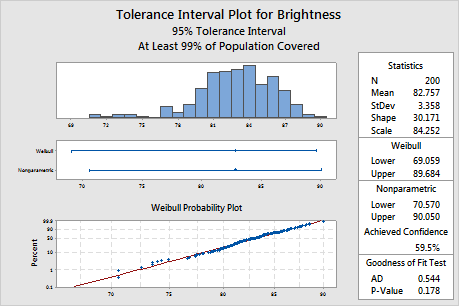
The probability plot shows that the plotted points fall along the Weibull distribution fitted line, which indicates that the data follow a Weibull distribution. Also, the p-value of the goodness-of-fit test is 0.178, which is greater than the significance level of 0.05. Because you cannot conclude that the data do not follow the Weibull distribution, you can use the interval for the Weibull distribution.
The Weibull interval ranges from approximately 69.1 to 89.7, so the manufacturer can be 95% confident that at least 99% of all batches of pulp will fall in this interval. For all the batches of pulp, the mean brightness level is approximately 82.8.
Method
| Distribution | Weibull |
|---|---|
| Confidence level | 95% |
| Percent of population in interval | 99% |
Statistics
| Variable | N | Mean | StDev |
|---|---|---|---|
| Brightness | 200 | 82.757 | 3.358 |
Distribution Parameters
| Variable | Shape | Scale |
|---|---|---|
| Brightness | 30.171 | 84.252 |
95% Tolerance Interval
| Variable | Weibull Method | Nonparametric Method | Achieved Confidence |
|---|---|---|---|
| Brightness | (69.059, 89.684) | (70.570, 90.050) | 59.54% |