In This Topic
Step 1: Use the ANOVA table to identify significant factors and interactions
- Operator: The variation that is from the operators.
- Part (Operator): The variation that is from the parts that are nested within each operator.
- Error or repeatability: The variation that is not explained by part or operator.
Key Result: P
In this example, the p-value for Operator is 0.773. Because the p-value is greater than 0.05, you fail to reject the null hypothesis and can conclude that the average strength measurement probably does not depend on which operator takes the measurements. The p-value for Part (Operator) is 0.000 and is less than 0.05. The average measurements of different parts nested within each operator are significantly different.
Step 2: Assess the variation for each source of measurement error
- Total Gage R&R: The sum of the repeatability and the reproducibility variance components.
- Repeatability: The variability in measurements when the same operator measures parts from the same batch.
- Reproducibility: The variability in measurements when different operators measure the parts.
- Part-to-Part: The variability in measurements due to different parts.
Note
If an operator can measure a part only once (such as with destructive testing), you must be able to assume that all parts within a single batch are identical enough to claim that they are the same part. If you are unable to make that assumption then part-to-part variation within a batch will mask the measurement system variation.
Ideally, very little of the variability should be due to repeatability and reproducibility. Differences between parts (Part-to-Part) should account for most of the variability.
Variance Components
| Source | VarComp | %Contribution (of VarComp) |
|---|---|---|
| Total Gage R&R | 0.14601 | 5.62 |
| Repeatability | 0.14601 | 5.62 |
| Reproducibility | 0.00000 | 0.00 |
| Part-To-Part | 2.45079 | 94.38 |
| Total Variation | 2.59679 | 100.00 |
Key Results: VarComp, %Contribution
The %Contribution for Total Gage R&R is 5.62% and for Part-to-Part variation is 94.38%. When the %Contribution from part-to-part variation is high, the measurement system can reliably distinguish between parts.
Gage Evaluation
| Source | StdDev (SD) | Study Var (6 × SD) | %Study Var (%SV) |
|---|---|---|---|
| Total Gage R&R | 0.38211 | 2.29265 | 23.71 |
| Repeatability | 0.38211 | 2.29265 | 23.71 |
| Reproducibility | 0.00000 | 0.00000 | 0.00 |
| Part-To-Part | 1.56550 | 9.39300 | 97.15 |
| Total Variation | 1.61146 | 9.66874 | 100.00 |
Key Results: %Study Var
Use the percent study variation (%Study Var) to compare the measurement system variation to the total variation. The %Study Var uses the process variation, as defined by 6 times the process standard deviation. Minitab displays the %Tolerance column when you enter a tolerance value, and Minitab displays the %Process column when you enter a historical standard deviation.
According to AIAG guidelines, if the measurement system variation is less than 10% of the process variation, then the measurement system is acceptable. The Total Gage R&R is 23.71% of the study variation. The Total Gage R&R variation might be acceptable depending on the application. Corrective action for improving the measurement system might include training operators or acquiring better gages. For more information, go to Is my measurement system acceptable?.
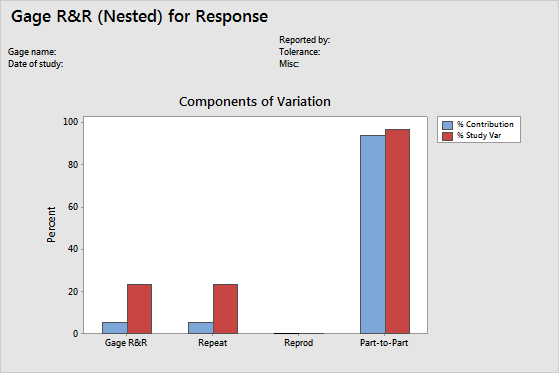
Key Results: Components of Variation graph
The components of variation graph shows the variation from the sources of measurement error. Minitab displays bars for %Tolerance when you enter a tolerance value, and Minitab displays bars for %Process when you enter a historical standard deviation.
This graphs shows that most of the variability is from Part-to-Part variation, which indicates that most of the measurement system variation is due to differences between parts.
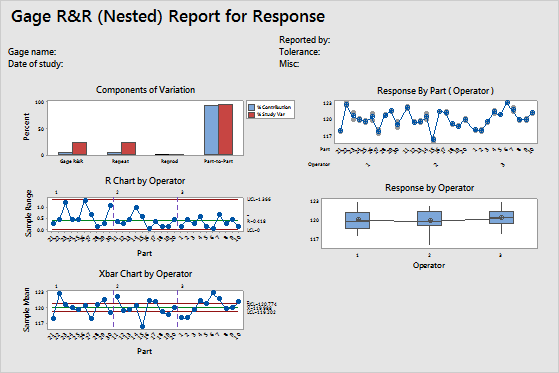
Step 3: Examine the graphs for more information on the gage study
- Components of variation graph
- Shows whether the largest of component of variation is part-to-part variation.
- R chart by operator
- Shows whether any points fall above the upper control limit.
- Xbar chart by operator
- Shows whether most points fall beyond the control limits.
- Measurements by part (operator) graph
- Shows whether multiple measurements for each part by each operator are close together, which indicates between-part variability and within-part variability.
- Measurements by operator graph
- Shows whether differences between operators are small compared to the differences between parts.