In This Topic
Choose subgroups to display
To see only the most recent subgroups instead of all subgroups, enter the number of subgroups to include in the chart. Minitab still uses all the data to calculate the control limits and the center line.
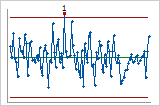
- All
-
By default, Minitab displays all subgroups.
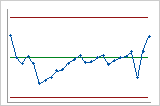
- Last
-
This chart displays only the most recent number of subgroups that you enter. By default, Minitab displays the last 25 subgroups.
Split chart into a series of segments for display purposes
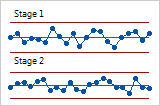
When you have a large number of subgroups or observations, consider splitting your control chart into segments for easier interpretation.
If your chart has stages, Minitab calculates separate control limits and center line estimates for each segment.
This control chart is split into two segments, by stage.
Other display options
Select Display test results in output tab to show a text summary of the test results.
Select Display control limit / center line labels for all stages to display labels for the control limits and the center lines for all stages. If you don't display the labels for all stages, you can still view the labels by holding the pointer over the lines.
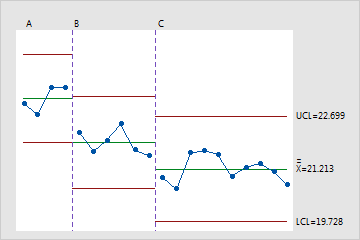
Display labels only for the final stage
This is the default setting.
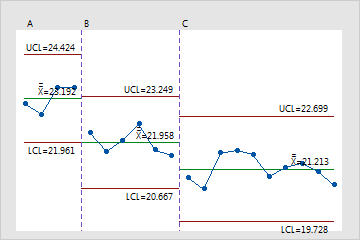
Display labels for all stages
You can choose to display labels for all stages.