A quality engineer monitors the manufacture of liquid detergent and wants to assess whether the process is in control. The engineer measures the pH of 25 consecutive batches of detergent.
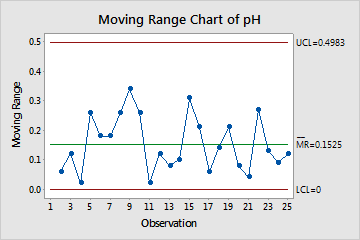
The engineer creates a Moving Range chart to monitor the detergent process.
- Open the sample data, DetergentpH.MWX.
- Choose .
- In Variables, enter pH.
- Click MR Options.
- On the Tests tab, select 1 point > K standard deviations from center line (Test 1) and K points in a row on same side of center line (Test 2).If you are not sure which tests apply in your specific situation, use Tests 1 and 2.
- Click OK in each dialog box.
Interpret the results
None of the points are outside the control limits, and the points display a random pattern on the moving range chart. Thus, the process variation is in control, and the engineer can use the Individuals chart to examine the process center.