A supervisor at a small hospital wants to ensure that the number of errors in the hospital's medical records remains in control. The supervisor records the total number of medical records that are filed each day and the number of records that are incomplete or inaccurate (defectives).
The number of records is high, with an average subgroup size of more than 2500. The data exhibit a large amount of overdispersion. So the supervisor decides to use a Laney P' chart instead of a traditional P chart to monitor patient records.
- Open the sample data, DefectiveRecords.MWX.
- Choose .
- In Variables, enter Defectives.
- In Subgroup sizes, enter Total Records.
- Click P′ Chart Options.
- On the Tests tab, select 1 point > K standard deviations from center line (Test 1) and K points in a row on same side of center line (Test 2).If you are not sure which tests apply in your specific situation, use Tests 1 and 2 when you first establish the control limits based on your data.
- Click OK in each dialog box.
Interpret the results
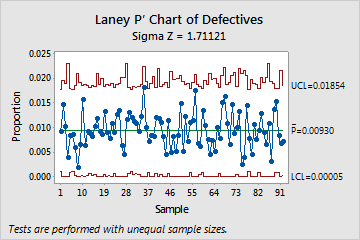
Because the sample sizes are unequal, the control limits vary. The Sigma Z value (approximately 1.7) is greater than 1, which indicates that the control limits on the Laney P' chart are wider than those on a traditional P chart to adjust for overdispersion. None of the subgroups failed the tests for special causes, so the supervisor concludes that proportion of defectives is in control.