or
In Graph variables, enter multiple columns of numeric or date/time data that you want to graph.
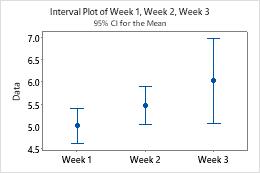
This worksheet contains the fill weights for a food product each week for three weeks. Week 1, Week 2, and Week 3 are the graph variables. The graph shows the confidence interval for the mean fill weight each week.
| C1 | C2 | C3 |
|---|---|---|
| Week 1 | Week 2 | Week 3 |
| 5.03 | 5.71 | 5.73 |
| 5.19 | 5.37 | 5.32 |
| 4.98 | 5.26 | 6.25 |
| ... | ... | ... |