The following images show the elements that you can display on a histogram. To select elements when you create the graph, click Data View. To change the elements on an existing graph, use the following steps:
- Double-click the graph to open the Options pane. The Options pane provides a subset of the possible graph editing options.
- Select More Options to open the Edit Graph dialog box and access all the graph editing options.
- Right-click the graph and choose .
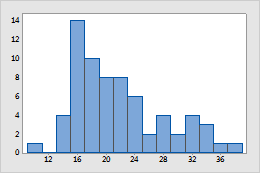
Bars (default)
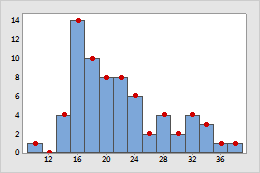
Symbols
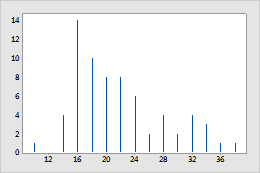
Project lines
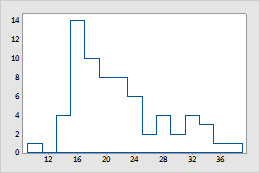
Area
Note
For more information on editing these graph features, go to the following topics.
