In This Topic
- Counts of unique values: Simple
- Counts of unique values: Cluster
- Counts of unique values: Stack
- A function of a variable: One Y: Simple
- A function of a variable: One Y: Cluster
- A function of a variable: One Y: Stack
- A function of a variable: Multiple Y’s: Simple
- A function of a variable: Multiple Y’s: Cluster
- A function of a variable: Multiple Y’s: Stack
- Values from a table: One column of values: Simple
- Values from a table: One column of values: Cluster
- Values from a table: One column of values: Stack
- Values from a table: Two-way table: Cluster
- Values from a table: Two-way table: Stack
Counts of unique values: Simple
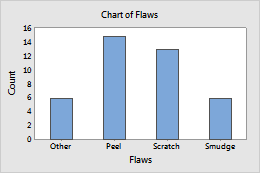
Create a bar chart that displays counts of unique values for one variable. The worksheet must include at least one column of categorical data.
For example, in the following worksheet, Flaws contains the categorical data. The graph shows the counts of each flaw type.
| C1-T |
|---|
| Flaws |
| Scratch |
| Scratch |
| Peel |
| ... |
For more information, go to Create a bar chart of counts of unique values: simple.
Counts of unique values: Cluster
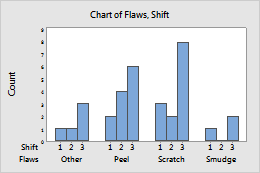
Create a bar chart that displays counts of unique values for multiple-level groups. Multiple-level groups are displayed as clustered bars. The worksheet must include at least two columns of categorical data. The columns must have the same number of rows. Groups are defined by unique combinations of values in the categorical variables.
For example, in the following worksheet, Flaws and Shift contain the categorical data. The graph shows the counts of flaws for each work shift, clustered by flaw type.
| C1-T | C2 |
|---|---|
| Flaws | Shift |
| Scratch | 1 |
| Scratch | 2 |
| Peel | 3 |
| ... | ... |
For more information, go to Create a bar chart of counts of unique values: cluster.
Counts of unique values: Stack
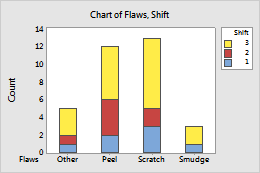
Create a bar chart that displays counts of unique values for multiple-level groups. Multiple-level groups are displayed as stacked bars. The worksheet must include at least two columns of categorical data. The columns must have the same number of rows. Groups are defined by unique combinations of values in the categorical variables.
For example, in the following worksheet, Flaws and Shift contain the categorical data. The graph shows the counts of flaws for each flaw type, stacked by work shift.
| C1-T | C2 |
|---|---|
| Flaws | Shift |
| Scratch | 1 |
| Scratch | 2 |
| Peel | 3 |
| ... | ... |
For more information, go to Create a bar chart of counts of unique values: stack.
A function of a variable: One Y: Simple
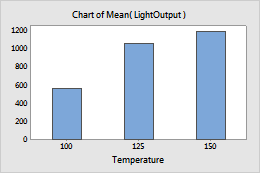
Create a bar chart that displays the mean or other function of a variable, divided into groups. The worksheet must include at least one column of numeric or date/time data and a corresponding column of categorical data. Groups are defined by unique values in the categorical variable.
For example, in the following worksheet, LightOutput contains the numeric data and Temperature contains the categorical data. The graph shows the mean of the light output for each temperature.
| C1 | C2 |
|---|---|
| LightOutput | Temperature |
| 580 | 100 |
| 1090 | 125 |
| 1392 | 150 |
| ... | ... |
For more information, go to Create a bar chart of a function of one Y variable: simple.
A function of a variable: One Y: Cluster
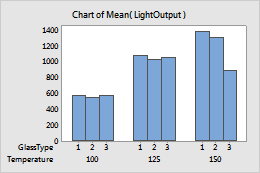
Create a bar chart that displays the mean or other function of a variable divided into multiple-level groups. Multiple-level groups are displayed as clustered bars. The worksheet must include at least one column of numeric or date/time data and at least two corresponding columns of categorical data.
For example, in the following worksheet, LightOutput contains the numeric data and Temperature and GlassType contain the categorical data. The graph shows the mean of the light output for each glass type, clustered by temperature.
| C1 | C2 | C3 |
|---|---|---|
| LightOutput | Temperature | GlassType |
| 580 | 100 | 1 |
| 1090 | 125 | 1 |
| 1392 | 150 | 1 |
| ... | ... | ... |
For more information, go to Create a bar chart of a function of one Y variable: cluster.
A function of a variable: One Y: Stack
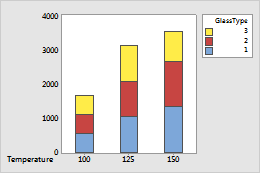
Create a bar chart that displays the mean or other function of a variable divided into multiple-level groups. Multiple-level groups are displayed as stacked bars. The worksheet must include at least one column of numeric or date/time data and at least two corresponding columns of categorical data.
For example, in the following worksheet, LightOutput contains the numeric data and Temperature and GlassType contain the categorical data. The graph shows the mean of the light output for each temperature, stacked by glass type.
| C1 | C2 | C3 |
|---|---|---|
| LightOutput | Temperature | GlassType |
| 580 | 100 | 1 |
| 1090 | 125 | 1 |
| 1392 | 150 | 1 |
| ... | ... | ... |
For more information, go to Create a bar chart of a function of one Y variable: stack.
A function of a variable: Multiple Y’s: Simple
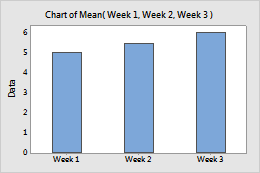
Create a bar chart that displays the mean or other function of several variables. The worksheet must include multiple columns of numeric or date/time data.
For example, the following worksheet contains the fill weights for a food product each week for three weeks. Week 1, Week 2, and Week 3 are the numeric columns. The graph shows the means of fill weights for each week.
| C1 | C2 | C3 |
|---|---|---|
| Week 1 | Week 2 | Week 3 |
| 5.19 | 5.37 | 5.73 |
| 5.03 | 5.11 | 5.48 |
| 4.98 | 5.26 | 5.62 |
| ... | ... | ... |
For more information, go to Create a bar chart of a function of multiple Y variables: simple.
A function of a variable: Multiple Y’s: Cluster
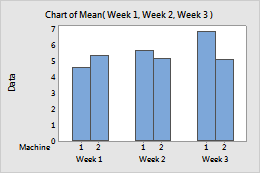
Create a bar chart that displays the mean or other function of several continuous variables, divided into groups. Groups are displayed as clustered bars. The worksheet must include multiple columns of numeric or date/time data and at least one corresponding column of categorical data.
For example, the following worksheet contains the fill weights for a food product that was produced each week for three weeks, on two machines. Week 1, Week 2, and Week 3 are the numeric columns, and Machine contains the categorical data. The graph shows the means of the fill weights for each machine, clustered by week.
| C1 | C2 | C3 | C4 |
|---|---|---|---|
| Week 1 | Week 2 | Week 3 | Machine |
| 5.19 | 5.37 | 5.73 | 1 |
| 5.03 | 5.11 | 5.48 | 2 |
| 4.98 | 5.26 | 5.62 | 1 |
| ... | ... | ... | ... |
For more information, go to Create a bar chart of a function of multiple Y variables: cluster.
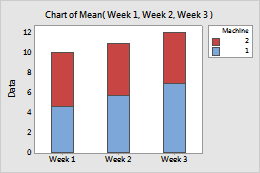
A function of a variable: Multiple Y’s: Stack
Create a bar chart that displays the mean or other function of several continuous variables, divided into groups. Groups are displayed as stacked bars. The worksheet must include multiple columns of numeric or date/time data and at least one corresponding column of categorical data.
For example, the following worksheet contains the fill weights for a food product that was produced each week for three weeks, on two machines. Week 1, Week 2, and Week 3 are the numeric columns, and Machine contains the categorical data. The graph shows the means of the fill weights produced each week, stacked by machine.
| C1 | C2 | C3 | C4 |
|---|---|---|---|
| Week 1 | Week 2 | Week 3 | Machine |
| 5.19 | 5.37 | 5.73 | 1 |
| 5.03 | 5.11 | 5.48 | 2 |
| 4.98 | 5.26 | 5.62 | 1 |
| ... | ... | ... | ... |
For more information, go to Create a bar chart of a function of multiple Y variables: stack.
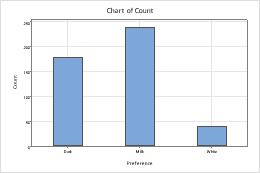
Values from a table: One column of values: Simple
Create a bar chart that displays the summarized data for groups. Groups are defined by a values of a categorical variable. The worksheet must include at least one column of summarized data and one corresponding column of categorical data.
For example, in the following worksheet, Count contains the summarized data and Preference contains the categorical data. The graph shows counts for each type of chocolate preference.
| C1 | C2 |
|---|---|
| Count | Preference |
| 177 | Dark |
| 237 | Milk |
| 39 | White |
For more information, go to Create a bar chart of a table with one column of values: simple.
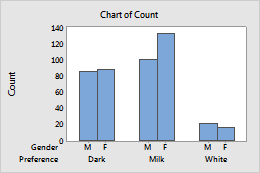
Values from a table: One column of values: Cluster
Create a bar chart that displays summarized data for multiple-level groups. Multiple-level groups are displayed as clustered bars. The worksheet must include at least one column of summarized data and at least two columns of categorical data. Groups are defined by unique combinations of values in categorical variables.
For example, in the following worksheet, Count contains the summarized data and Preference and Gender contain the categorical data. The graph shows the counts for each gender, clustered by chocolate preference.
| C1 | C2 | C3 |
|---|---|---|
| Count | Preference | Gender |
| 87 | Dark | M |
| 102 | Milk | M |
| 22 | White | M |
| 90 | Dark | F |
| 135 | Milk | F |
| 17 | White | F |
For more information, go to Create a bar chart of a table with one column of values: cluster.
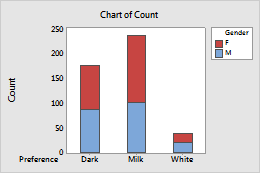
Values from a table: One column of values: Stack
Create a bar chart that displays summarized data for multiple-level groups. Multiple-level groups are displayed as stacked bars. The worksheet must include at least one column of summarized data and at least two columns of categorical data. Groups are defined by unique combinations of values in categorical variables.
For example, in the following worksheet, Count contains the summarized data and Preference and Gender contain the categorical data. The graph shows the counts for each chocolate preference, stacked by gender.
| C1 | C2 | C3 |
|---|---|---|
| Count | Preference | Gender |
| 87 | Dark | M |
| 102 | Milk | M |
| 22 | White | M |
| 90 | Dark | F |
| 135 | Milk | F |
| 17 | White | F |
For more information, go to Create a bar chart of a table with one column of values: stack.
Values from a table: Two-way table: Cluster
Create a bar chart that displays summarized values for multiple-level groups. Multiple-level groups are displayed as clustered bars. The worksheet must include multiple columns of summarized data and one column of categorical data for row labels. Groups are defined by each column/row combination.
For example, in the following worksheet 1st shift, 2nd shift, and 3rd shift contain the summarized data and Machine ID contains the row labels. The graph shows the data for each machine, grouped by work shift.
| C1 | C2 | C3 | C4 |
|---|---|---|---|
| Machine ID | 1st shift | 2nd shift | 3rd shift |
| 1 | 48 | 47 | 48 |
| 2 | 76 | 47 | 32 |
| 3 | 36 | 40 | 34 |
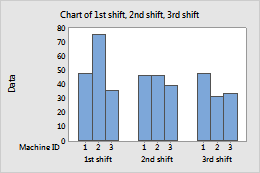
For more information, go to Create a bar chart of a two-way table: cluster.
Values from a table: Two-way table: Stack
Create a bar chart that displays summarized values for multiple-level groups. Multiple-level groups are displayed as stacked bars. The worksheet must include multiple columns of summarized data and one column of categorical data for row labels. Groups are defined by each column/row combination.
For example, in the following worksheet 1st shift, 2nd shift, and 3rd shift contain the summarized data and Machine ID contains the row labels. The graph shows the data for each work shift, stacked by machine.
| C1 | C2 | C3 | C4 |
|---|---|---|---|
| Machine ID | 1st shift | 2nd shift | 3rd shift |
| 1 | 48 | 47 | 48 |
| 2 | 76 | 47 | 32 |
| 3 | 36 | 40 | 34 |
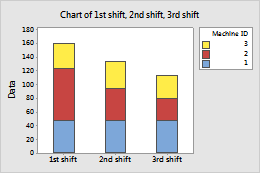
For more information, go to Create a bar chart of a two-way table: stack.