Maximum likelihood estimates of distribution parameters
The method of maximum likelihood is used to estimate the values of the distribution parameters that maximize the likelihood function for each distribution. The goal is to obtain the best "agreement" between the distribution model and the observed sample data.
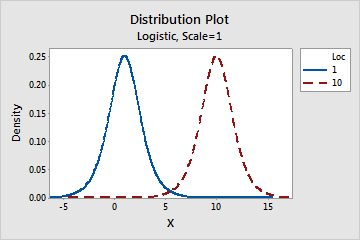
- Location
- This parameter affects the location of a distribution. For example, with
different location parameters, a logistic distribution can be shifted along
the horizontal axis.
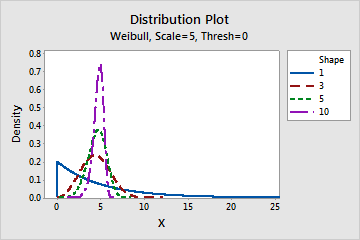
- Shape
- This parameter affects the shape of the distribution. For example, with
different shape parameters, a Weibull distribution can appear more skewed or
more symmetric.
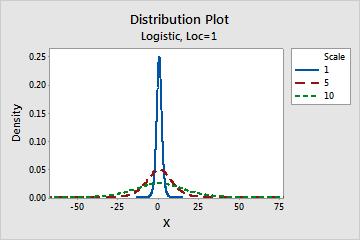
- Scale
- This parameter affects the scale of the distribution. For example, with
different scale parameters, a logistic distribution can appear more
"stretched out" or more compressed.
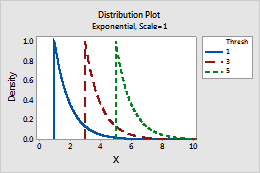
- Threshold
- This parameter affects the minimum value of a random variable. For example,
with different threshold parameters, an exponential distribution can be
defined over a different range of values.
Note
Minitab calculates the parameter estimates using maximum likelihood method for all the distributions except normal and lognormal distributions, which instead use unbiased parameter estimates.
Interpretation
Use the maximum likelihood estimates of the distribution parameters to understand the specific distribution model that is used for your data. For example, suppose a quality engineer decides that, based on historical process knowledge and the Anderson-Darling and LRT p-values, the 3-parameter Weibull distribution provides the best fit for the process data. To understand the specific 3-parameter Weibull distribution that is used to model the data, the engineer examines the maximum likelihood estimates for shape, scale, and threshold that are calculated for the distribution.
Distribution
Individual distribution identification provides goodness-of-fit statistics and distribution parameters for several commonly used distributions. Many of these distributions are versatile and can model a variety of continuous data, including data with positive values, negative values, and 0.
- 2-parameter lognormal
- 1-parameter exponential
- 2-parameter Weibull
- 2-parameter gamma
- 2-parameter loglogistic
Therefore, if your data contain negative values or 0, Minitab does not report results for these specific distributions. In that case, use the results for the higher-parameter version of each distribution. For example, if your data contain negative values, Minitab does not report results for the 2-parameter lognormal distribution. Instead, use the results for the 3-parameter lognormal distribution.
For more information on the distributions used in individual distribution identification, go to Why is Weibull the default distribution for nonnormal capability analysis?.
Note
For information on the formulas that are used to calculate the PDF and CDF for each distribution, go to Methods and formulas for distributions in Individual Distribution Identification.