A quality engineer wants to determine whether a steel bar cutting process is in control. The engineer measures the length of five steel bars for ten shifts.
The engineer creates a zone chart to monitor the length of steel bars.
- Open the sample data, SteelBarLength.MWX.
- Choose .
- From the drop-down list, select All observations for a chart are in one column, enter Length.
- In Subgroup sizes, enter Subgroup ID.
- Click Zone Options, then select the Weights/Reset tab.
- Check Reset cumulative score after each signal.If you investigate and correct your process when it is out-of-control, it is appropriate to reset the cumulative score.
- Click OK in each dialog box.
Interpret the results
For the steel bar length data, subgroup 5 has a cumulative score of 8, and subgroup 10 has a cumulative score of 8. The manufacturing process is out of control.
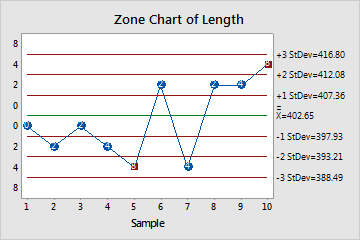
Test Results for Zone Chart of Length
| TEST. Cumulative score greater than or equal to zone 4 score. |
|---|
| Test Failed at points: 5, 10 |