In This Topic
Correlation Matrix
The correlation matrix shows the Pearson correlation values, which measure the degree of linear relationship between each pair of items or variables. The correlation values can fall between -1 and +1. However, in practice, items generally have positive correlations. If the two items tend to increase and decrease together, the correlation value is positive.
Interpretation
Use the correlation matrix to assess the strength and direction of the relationship between two items or variables. A high, positive correlation values indicates that the items measure the same skill or characteristic. If the items are not highly correlated, then the items may measure different characteristics or may not be clearly defined.
Often, variables with correlation values greater than 0.7 are considered highly correlated. However, the appropriate benchmark value to use also depends on the standards in your subject area and the number of items in the analysis.
In these results, all the items are highly correlated to each other. Item 1 and Item 2 have a positive linear correlation of 0.903. Item 1 and Item 3 have a positive linear correlation of 0.867, and Item 2 and Item 3 have a positive linear correlation of 0.864. Therefore, these items appear to measure the same characteristic.
Covariance Matrix
The covariance matrix displays the covariance values, which measure the linear relationship for each pair of items or variables. Positive covariance values indicate that above average values of one variable are associated with above average values of the other variable, and that below average values of one variable are associated with below average values of another variable. Negative covariance values indicate that above average values of one variable are associated with below average values of the other variable.
Unlike the correlation coefficient, the covariance is not standardized. Therefore, covariance values can range from negative infinity to positive infinity and can be difficult to interpret. To more easily interpret the linear relationship between each pair of items or variables, use the correlation matrix.
Mean
The mean is the sum of the observations divided by the number of observations. Minitab calculates the mean of each item and the total mean. The item mean is the sum of all the scores for one item divided by the number of scores for that item. The total mean is the sum of all the item means.
Interpretation
Use the item mean to describe the scores for each item or variable with a single value that represents the center of the data.
Item and Total Statistics
| Variable | Total Count | Mean | StDev |
|---|---|---|---|
| Item 1 | 50 | 3.1600 | 1.2675 |
| Item 2 | 50 | 2.8400 | 1.3607 |
| Item 3 | 50 | 2.9400 | 1.3463 |
| Total | 50 | 8.9400 | 3.8087 |
In these results, the mean score of Item 1 is the highest (3.16) and the mean score of Item 2 is the lowest (2.84). The total mean is the sum of means for all three items.
StDev
The standard deviation (StDev) is a measure of dispersion, or how spread out the data are about the mean. Minitab calculates the standard deviation of the scores for each item or variable, as well as the total of the standard deviations.
Interpretation
Use the standard deviation for the items to determine how spread out the scores are from the mean for each item.
Item and Total Statistics
| Variable | Total Count | Mean | StDev |
|---|---|---|---|
| Item 1 | 50 | 3.1600 | 1.2675 |
| Item 2 | 50 | 2.8400 | 1.3607 |
| Item 3 | 50 | 2.9400 | 1.3463 |
| Total | 50 | 8.9400 | 3.8087 |
In these results, the scores for Item 2 have the highest standard deviation (1.3607). This indicates that the scores for Item 2 have the greatest variability of the three items. Item 1 has the lowest standard deviation (1.2675) and the lowest variability of scores. The total standard deviation is the sum of standard deviations for all three items.
Cronbach's alpha
Cronbach's alpha is a measure of internal consistency that is calculated using sample variance, total scores, and number of items.
Interpretation
Use Cronbach's alpha to assess how consistently multiple items in a survey or test assess the same skill or characteristic. Higher values of Cronbach's alpha suggest higher internal consistency. A benchmark value of 0.7 is commonly used. Generally, if Cronbach's alpha is greater than 0.7, then you have evidence that the survey or test items measure the same skill or characteristic. If Cronbach's alpha is below 0.7, then the items may not reliably measure a single skill or characteristic to conclude that at least some of the items measure the same characteristic. However, the appropriate benchmark value to use also depends on the standards in your subject area and the number of items in the analysis.
Cronbach’s Alpha
| Alpha |
|---|
| 0.9550 |
In these results, the overall Cronbach's alpha is 0.9550. The value is greater than the common benchmark of 0.7 and suggests that the items are measuring the same characteristic.
Adj Total Mean
The adjusted total mean is the sum of all the item means, excluding the mean of the omitted item.
Interpretation
Use the adjusted total mean to see how the value of the total mean changes when an item is removed from the analysis.
Omitted Item Statistics
| Omitted Variable | Adj. Total Mean | Adj. Total StDev | Item-Adj. Total Corr | Squared Multiple Corr | Cronbach’s Alpha |
|---|---|---|---|---|---|
| Item 1 | 5.780 | 2.613 | 0.9166 | 0.8447 | 0.9268 |
| Item 2 | 6.100 | 2.525 | 0.9134 | 0.8413 | 0.9277 |
| Item 3 | 6.000 | 2.563 | 0.8870 | 0.7869 | 0.9476 |
In these results, the adjusted total mean when Item 1 is omitted from the analysis is 5.780. That is, the sum of the mean score for Item 2 and the mean score for Item 3 is 5.780.
Adj Total StDev
The adjusted total standard deviation is the standard deviation of the total score after omitting an item.
Interpretation
Use the adjusted total standard deviation to see how the value of the total standard deviation changes when an item is removed from the analysis.
Omitted Item Statistics
| Omitted Variable | Adj. Total Mean | Adj. Total StDev | Item-Adj. Total Corr | Squared Multiple Corr | Cronbach’s Alpha |
|---|---|---|---|---|---|
| Item 1 | 5.780 | 2.613 | 0.9166 | 0.8447 | 0.9268 |
| Item 2 | 6.100 | 2.525 | 0.9134 | 0.8413 | 0.9277 |
| Item 3 | 6.000 | 2.563 | 0.8870 | 0.7869 | 0.9476 |
In these results, the adjusted total standard deviation when Item 1 is omitted from the analysis is 2.613.
Item-Adj Total Corr
The item-adjusted total correlation is the correlation between the scores of one omitted item and the total scores of all other items. Although values of item-adjusted total correlation can theoretically range from -1 to 1, in practice, values usually range between 0 and 1.
Interpretation
Use item-adjusted total correlation to assess whether removing an item from the analysis improves the internal consistency. A higher value of item-adjusted correlation (closer to 1) suggests that the omitted item measures the same characteristic as the other items. If an omitted item has a low item-adjusted correlation value, a low squared multiple correlation value, and a substantially higher Cronbach's alpha value, then you might consider removing the item from the survey or test to improve its internal consistency.
Omitted Item Statistics
| Omitted Variable | Adj. Total Mean | Adj. Total StDev | Item-Adj. Total Corr | Squared Multiple Corr | Cronbach’s Alpha |
|---|---|---|---|---|---|
| Item 1 | 5.780 | 2.613 | 0.9166 | 0.8447 | 0.9268 |
| Item 2 | 6.100 | 2.525 | 0.9134 | 0.8413 | 0.9277 |
| Item 3 | 6.000 | 2.563 | 0.8870 | 0.7869 | 0.9476 |
In these results, the item-adjusted total correlation for Item 1 is 0.9166. The item-adjusted total correlation for Item 2 is 0.9134. The item-adjusted total correlation for item 3 is 0.8870. Because the item-adjusted total correlation for all items is consistently high, the evidence suggests that all items measure the same characteristic.
Squared Multiple Corr
The squared multiple correlation is the coefficient of determination (R2) when the omitted item is regressed on the remaining items. Values range between 0 and 1.
Interpretation
Use the squared multiple correlation values to assess whether removing an item from the analysis improves the internal consistency. A higher value of squared multiple correlation (closer to 1) suggests that the omitted item measures the same characteristic as the other items. If an omitted item has a low squared multiple correlation value, a low item-adjusted total correlation value, and a substantially higher Cronbach's alpha value, then you might consider removing the item from the survey or test to improve its internal consistency.
Omitted Item Statistics
| Omitted Variable | Adj. Total Mean | Adj. Total StDev | Item-Adj. Total Corr | Squared Multiple Corr | Cronbach’s Alpha |
|---|---|---|---|---|---|
| Item 1 | 5.780 | 2.613 | 0.9166 | 0.8447 | 0.9268 |
| Item 2 | 6.100 | 2.525 | 0.9134 | 0.8413 | 0.9277 |
| Item 3 | 6.000 | 2.563 | 0.8870 | 0.7869 | 0.9476 |
In these results, the squared multiple correlation for Item 1 is 0.8447. The squared multiple correlation for Item 2 is 0.8413. The squared multiple correlation for item 3 is 0.7869. Because the squared multiple correlation for all items is consistently high, the evidence suggests that all items measure the same characteristic.
Cronbach's Alpha (for an omitted item)
Cronbach's alpha for an omitted item is the value of Cronbach's alpha for the remaining items after one item is removed from the analysis. Cronbach's alpha is a measure of internal consistency that is calculated using sample variance, total scores, and number of items.
Interpretation
Use Cronbach's alpha for omitted items to assess whether removing an item from the analysis improves the internal consistency. Fairly consistent values of Cronbach's alpha for all omitted items suggest that all items measure the same characteristic. A substantially higher Cronbach's alpha for a specific omitted item suggests that it may not measure the same characteristic as the other items. If an omitted item has a low squared multiple correlation value, a low item-adjusted total correlation value, and a substantially higher Cronbach's alpha value, then you might consider removing the item from the survey or test to improve its internal consistency.
Omitted Item Statistics
| Omitted Variable | Adj. Total Mean | Adj. Total StDev | Item-Adj. Total Corr | Squared Multiple Corr | Cronbach’s Alpha |
|---|---|---|---|---|---|
| Item 1 | 5.780 | 2.613 | 0.9166 | 0.8447 | 0.9268 |
| Item 2 | 6.100 | 2.525 | 0.9134 | 0.8413 | 0.9277 |
| Item 3 | 6.000 | 2.563 | 0.8870 | 0.7869 | 0.9476 |
In these results, the Cronbach's alpha when item 1 is omitted is 0.9268. The Cronbach's alpha when item 2 is omitted is 0.9277. The Cronbach's alpha when item 3 is omitted is 0.9476. Because the Cronbach's alpha for all the omitted items is similar, the evidence suggests that all items measure the same characteristic.
Matrix Plot
The matrix plot is an array of scatterplots. Each scatterplot in the matrix graphs the scores for a pair of items on the x and y axes.
Interpretation
Use the plot to visually assess the relationship between every combination of items or variables.
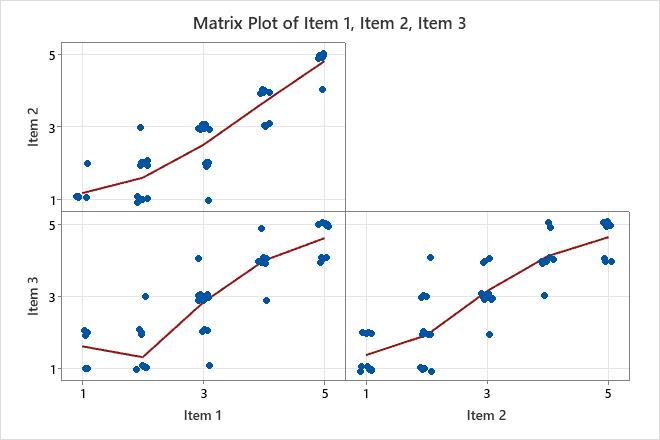
This matrix plot suggests that all pairs of items have a positive linear relationship.