Note
In the web app: To add a map in the web app, select Tools
![]() ,
then select Mapping or
search for a specific map by name.
,
then select Mapping or
search for a specific map by name.
Add a process map
- From the navigator pane, select Add Tool, then select Process Map.
- Select from several process map templates.
Add a cross-functional process map
Note
In the web app: To add cross-functionality to a process map,
in the web app, select
Shapes
![]() , then select Cross Functional Table
, then select Cross Functional Table
![]() and drag it to the map.
and drag it to the map.
To use a preformatted template, from the navigator pane, select Add Tool, then select Process Map - Cross Functional.
Insert departments
- Choose , then select a department option. You can add a department above or below the selected department.
- Enter a name for the department, then press Tab.
Insert phases
- Choose , then select a phase option. You can add a phase to the right or left of the selected phase.
- Enter a name for the phase, then press Tab.
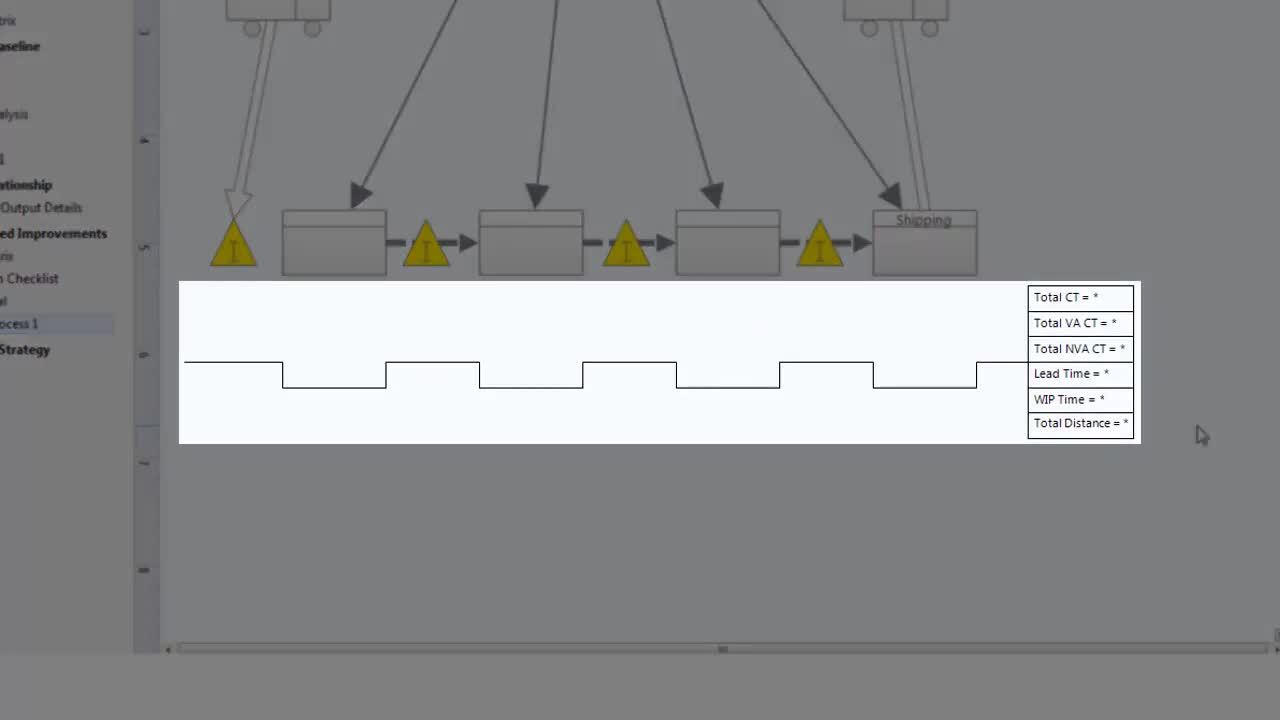
Add a value stream map
- From the navigator pane, select Add Tool, then select Value Stream Map.
- Select a template. Some templates start with blank shapes and some do not. If you opened a template that already has shapes and connectors, you can add data to the existing shapes. Go to Add data to a map.
Add shapes and connectors
Note
In the web app: To add shapes and connectors, select an item in the gallery and drag it to the map.
- Start

- Use the Start shape to represent the start of the process.
- End

- Use the End shape to represent the end of the process.
- Process

- Use the Process shape to represent a process, task, action, or operation.
- Decision

- Use the Decision shape to ask a question. The answer to the question determines which path you follow from the decision shape.
Common shapes for a value stream map are categorized as Basic Shapes, Inventory Shapes, Transport Shapes, and Scheduling Shapes shapes.
Complete the following steps to add shapes and connectors to your process map.
- In the Shapes gallery, select a shape, then select the workspace.
-
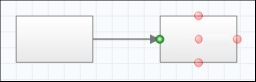
To connect the shapes, select a connector in the
Shapes
gallery.
To ensure that shapes stay connected even when you move them, connect the shapes at their
anchor points. Anchor points turn green when they are connected to a shape.
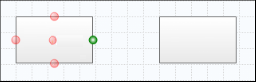
Start point
End point
Tip
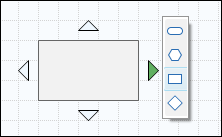
To quickly connect shapes at their anchor points, select a shape on the map, select the arrow in the direction where you want to place the new shape, then choose the shape. Workspace automatically connects and anchors the new shape to the existing shape.
Format shapes and connectors
You can customize the appearance of the shapes and connectors. You can customize individual items or you can set a format to use as the default.
Note
In the web app: To format shapes or connectors, select the item, then select Layout in the task pane. (You cannot set default formats and quick formats in the web app.)
- Right-click the shape or the connector, choose Format, then choose an option. After you format a shape or a connector, you can set the new format as the default.
- To set the new format as the default, right-click the shape or the connector, then choose . The next time you add a shape or a connector of the same type, the new default format is applied.
To create a set of reusable formatting options, go to Create and edit a Quick Format.
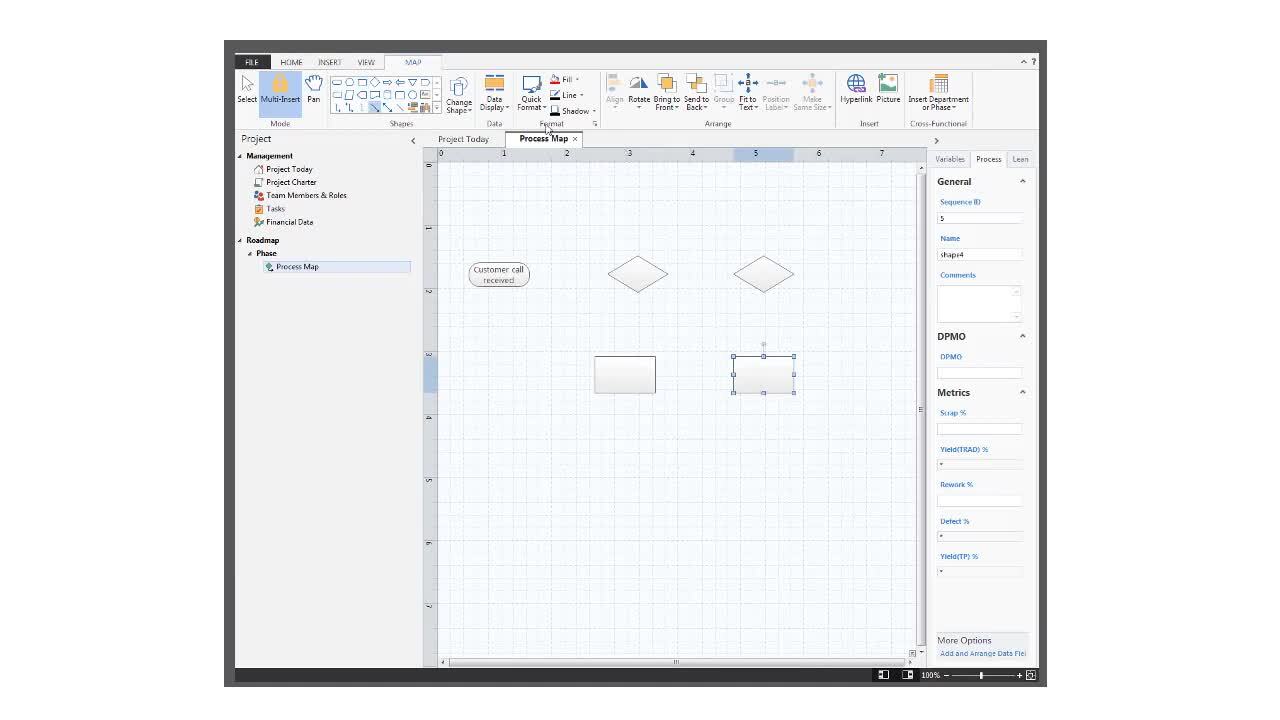
Add the same shape or connector multiple times
To save time, you can use Multi-Insert to add the same shape or connector to the map multiple times.
- Choose , then choose the shape or the connector to add.
-
Choose from the following options.
- For shapes, select the workspace until you add as many shapes as necessary.
- For connectors, hold the mouse pointer on a shape, select an anchor point, then drag the connector to an anchor point on a different shape. Use this method to connect as many shapes as necessary.
- Select Multi-Insert again to turn it off.
Add comments to a shape
-
Right-click the shape then choose one of the following.
- For a process map, choose .
- For a value stream map, choose .
-
In the task pane, enter a comment.
For a process map, the Comments field is in the task pane on the
Process tab. For a value stream map, the
Comments field is in the task pane on the
Other tab.
The comment symbol appears above the shape.
- To see the comment in a tooltip, hold the mouse pointer over the comment.
- To open or edit the comment in the task pane, double-click the comment.
Resize departments and phases
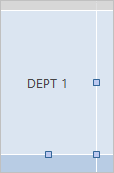
Selection handles on a department
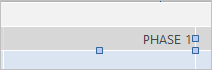
Selection handles on a phase
Tip
By default, when you resize a department or a phase, the shapes inside it move to stay within the borders. To resize a department or phase without regard to borders, press the Alt key as you drag the selection handle.
Watch a video
Process Maps
Watch a video to learn more about process maps.
Value Stream Maps
Watch a video to learn more about value stream maps.