Queue Results

The results of a Queue show how the Queue has performed over the time of the run.
To access a Queue's results, open the Queue properties dialog and select the Results
button or click results from it's Properties Tab on the ribbon.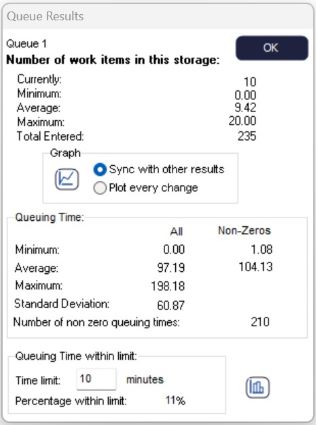
Results are displayed on the number of items that have entered the Queue and the time that Work Items spend in the Queue. This information is displayed numerically and graphically.
Numerical results can be added to the KPI Summary.

Click the histogram button to see a histogram showing the distribution of waiting times.

Click the time graph button to see the number of items in the Queue across time.
Overtime Results
If you have run the simulation with Overtime enabled, you will have additional overtime results available.