As Work Items move through a process, it is possible to associate them with states. A
state represents the current condition of a Work Item, and can be used to define
behavior based on the state a Work Item is in. State charts can be accessed from the
Drawing, and can especially be useful in healthcare simulations. Such an
example is when simulating the likelihood of illness in a population and how this may
affect the rate of patients entering an emergency room, or, when simulating how a
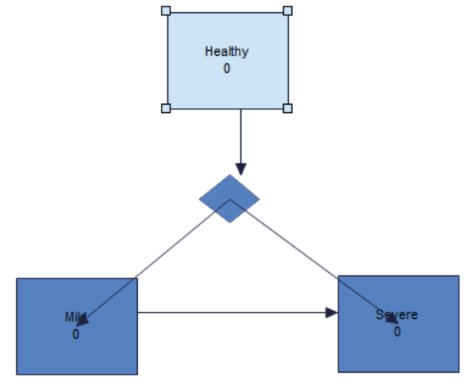
patient's illness may progress while they are treated in the hospital. For
instance, the State Charts in the image below demonstrate this change in health between
healthy, mild and severe cases.
Work Item State
The main object is the Work Item state which represents the different states the Work
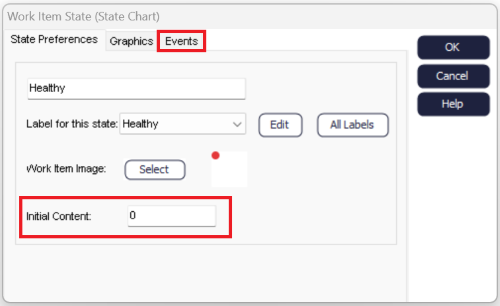
Item can transition between. A state can have an initial number of Work Items which
can be added by double clicking on the State chart object.
The dialog will then appear as in the image below. A start-up content can then be
added thought the initial content box. By selecting the Events tab,
Actions and Visual Logic
can also be added as well as the option to connect to a Start Point. If Work Items
are fed to the Start Point from a state it is important to note that the
arrival time of the
Start Point should be set at a high value if no other Work Item is to enter the
simulation.
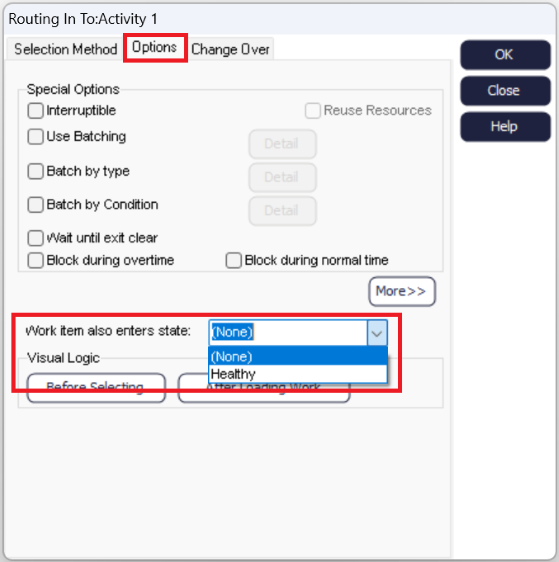
Work Items can also be sent to a state from the Start Point or an Activity by
selecting "also enters state" in the routing in section of the Options tab in the
dialog as in the figure below or by using Actions from the main ribbon by setting
the state Label to 1. This can also be done for a Queue by using Visual Logic and
setting the State Label to 1.
The transition between the States can either be represented by an arrow directly or
by a transition decision point.
Routing Arrows
The routing arrows can be used to connect the states. These can either be connected
one or both ways depending on the nature of the state. The rate in which Work Items
transition between states is selected by double clicking the arrow. This will lead
to the dialog below with options on various transition types.
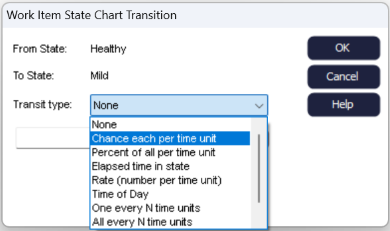
Any option with time unit will use the time selected from the clock feature (hour,
minute, second). The blank box under the selection wheel is then used to choose the
specific number to transition out of the state. So, if it is "rate (number per time
unit)" the number represents the number of Work Items, however if you select "one
every N time units" it would denote the number of seconds/minutes/hours it takes for
one Work Item, to transition out of the state.
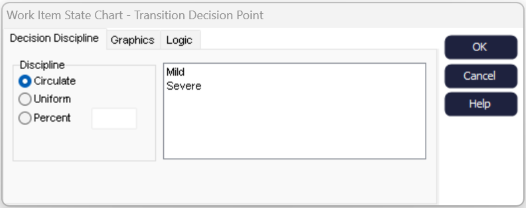
Transition Decision Point
The other option is to use a transition decision point, this can be used where there
is a chance that the Work Item will change state into one of several states. Which
state the Work Item enters can either be circulate, uniform or percentage. This is
decided in the dialog by double clinking on the transition decision point as in the
image below, on this Actions and Visual Logic can also be included by selecting the
Logic Tab.
When using a transition decision point, it is important to note that the arrows in
and out of the point should be adjusted to fit the simulation parameters needed. If
rules are used on the arrow routing in, you may want to set the arrows going out of
the point to always and vice versa.