The Supervisor Dashboard
provides a performance summary for all the measures from the online stations that you
supervise. At a glance, you can see which stations are running and the percentages that are
out-of-specification, out-of-action, and out-of-control.
The Supervisor Dashboard is available through the Operations portal
and serves as a home page for users with a supervisor role. It is similar to the
Current Performance Summary but is limited to the stations assigned to an operations supervisor. From this view,
you can open a station dashboard using the link to the right of the quality metrics.
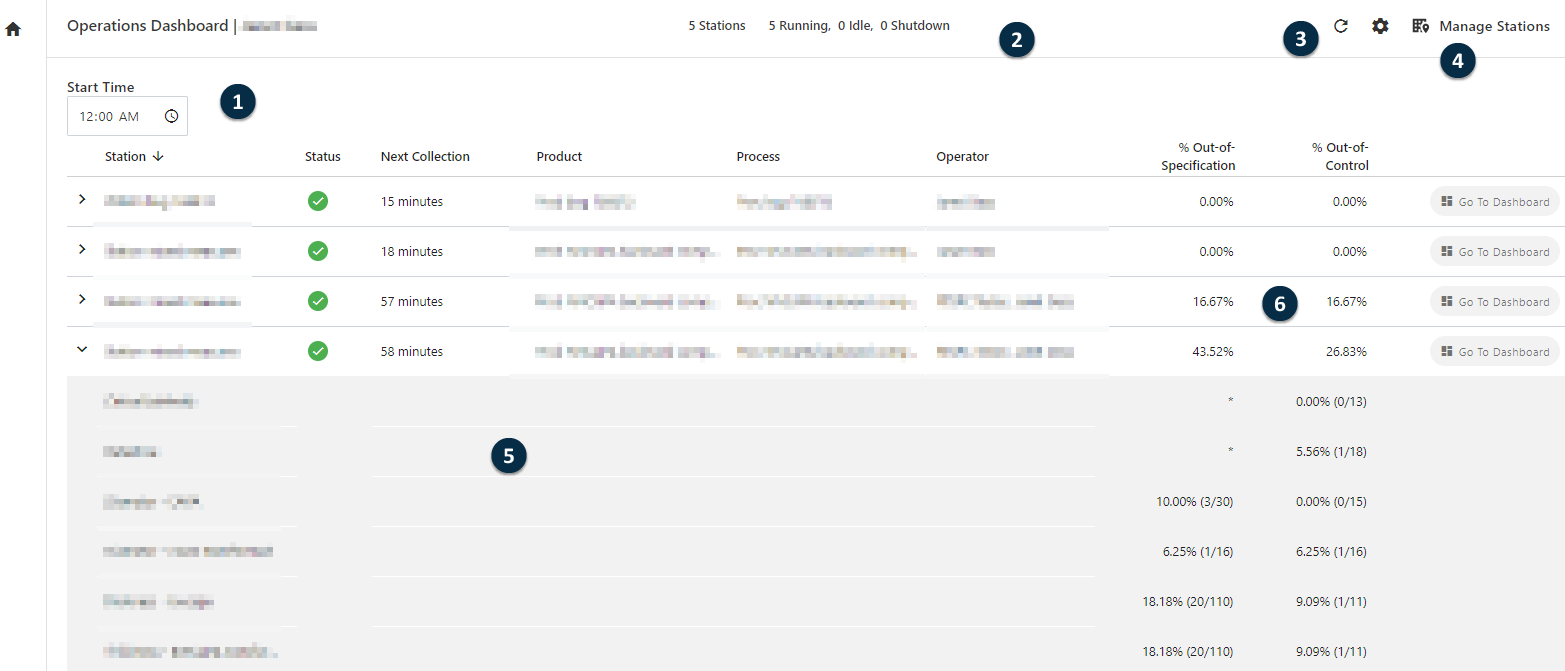
The Supervisor Dashboard has the following main areas.
1: Start time filter settings
Specify the start time for this dashboard. Usually, this view is for the
last 24 hours of performance.
2: Station summary
Shows a status summary of the stations so you can easily see how many
stations are running, idle, or shutdown.
3: Refresh data settings
Select the Refresh button to refresh the
data at any time. Use the Settings button to change the
automatic refresh rate.
4: Add and remove stations to the dashboard
Select Manage Stations at the top of the dashboard to add or remove stations from this
dashboard.
5: Manage and organize the dashboard columns
Choose which columns to display and arrange their order.
6: Station identification information
In the default view, stations are sorted by station performance. To
rearrange, sort by the column of your choice. You can also view the current
station status (Running, Idle,
or Shutdown).
7: Station performance information
The station performance columns summarize quality and net contents
performance across all selected stations. Expand the station to see the
performance by individual measure.
% Out-of-Specification
Displays the percentage of observations that are
out-of-specification for each station. Expand the station to see
the details for each measure.
% Out-of-MAV
Displays the percentage of observations that exceed the MAV net
contents thresholds for each station. Expand the station to see
the details for each measure.
% Out-of-T2
Displays the percentage of observations that exceed the T2 net
contents thresholds for each station. Expand the station to see
the details for each measure.
% Btwn T1-T2
Displays the percentage of observations that are between the T1
and T2 net contents thresholds for each station. Expand the
station to see the details for each measure.
% Out-of-T1
Displays the percentage of observations that exceed the T1 net
contents thresholds for each station. Expand the station to see
the details for each measure.
% Out-of-Action
Displays the percentage of subgroups that are out-of-action for
each station. Expand the station to see the details for each
measure.
% Out-of-Control
Displays the percentage of subgroups that are out-of-control for
each station. Expand the station to see the details for each
measure.
 button to refresh the
data at any time. Use the Settings
button to refresh the
data at any time. Use the Settings
 button to change the
automatic refresh rate.
button to change the
automatic refresh rate.