Details
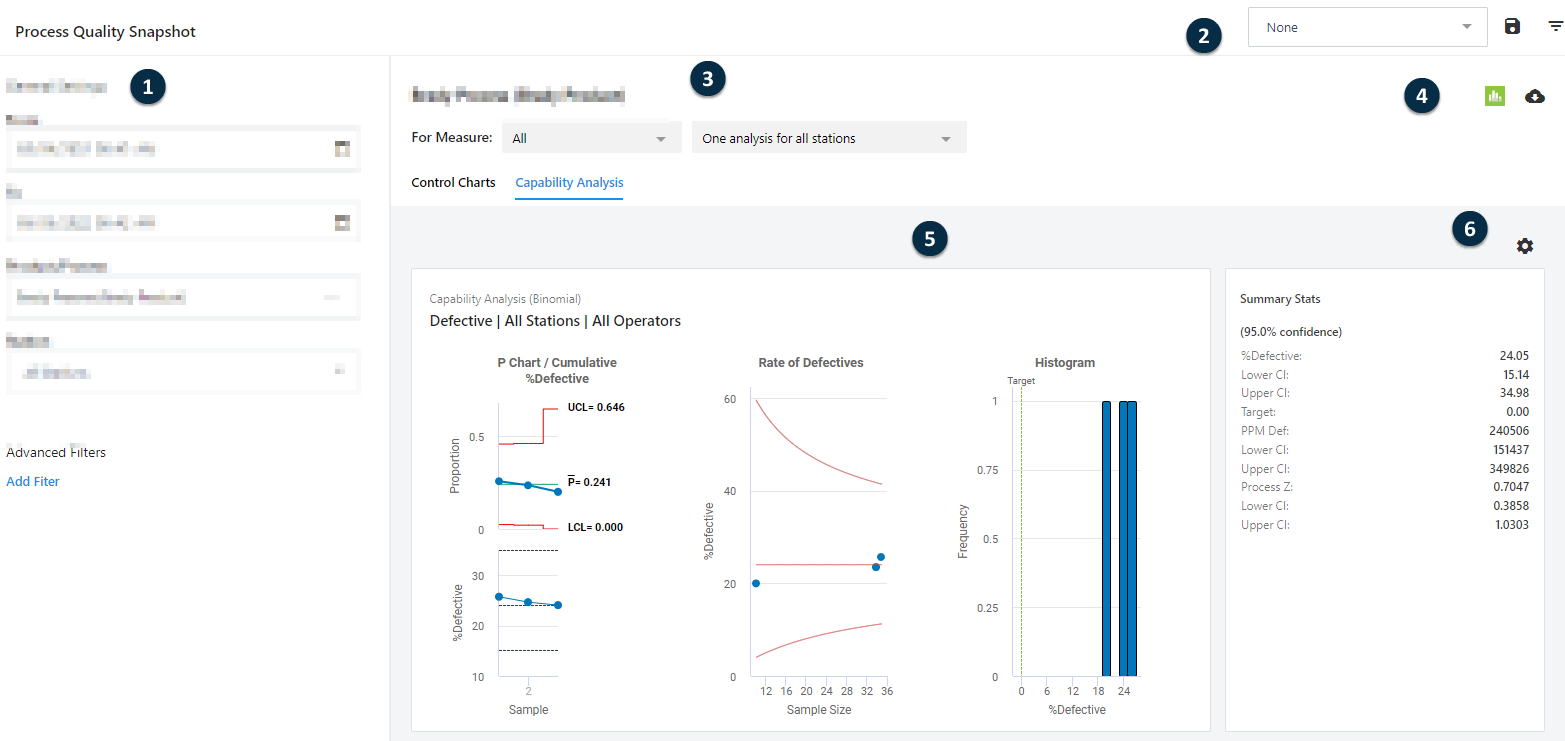
This view has the capability analysis tab open.
- 1: General settings
- The display settings are in a pane that can be expanded to change settings and collapsed to view the reports more easily. Select the stations of interest and their start and end times for the quality analyses. You can also add advanced filters to the display.
- 2: Station filter settings
- You can save
 and manage
  the filter settings.
- 3: Measure and analysis settings
- Display the analyses by measure, station, and operator. Switch between tabs to see control charts, capability analyses, and assignable causes.
- 4: Export data
- You can export the data from the selected time range to a Minitab worksheet (MWX) or to a CSV file.
- 5: Analysis display area
- View the analyses. You can access and edit the data from this view. For more information, go to Edit observations and descriptors.
- 6: Analysis settings and options
- Select the
 icon to the right of a control chart to
recalculate control limits from current data or to open the control
chart options.
icon to the right of a control chart to
recalculate control limits from current data or to open the control
chart options. Select the Settings
 icon to the
right of a capability analysis to modify the capability analysis
options.
icon to the
right of a capability analysis to modify the capability analysis
options.
Note
Real-Time SPC may limit the amount of data that is shown in the control charts to ensure optimum readability. To display more data, if available, select the link in the footer of the chart.
Save and manage filters
- Select the time frame, products, processes, and stations.
-
Select Save Filter
.
- Enter a name for your new filter and decide whether to set as the default view.
- Select OK.
-
Select Manage Filters
to delete filters or set
a new default filter.
Advanced filters for descriptors
Use advanced filters to focus analyses on specific operators or subgroup descriptors across stations.
Complete the following steps to add filters by subgroup descriptors.- Under Advanced Filters, select Add filter.
- Enter the operators and descriptors to use in the filter.
Control Charts
View control charts for the measures of the selected stations. Select the measure of interest and choose whether to view by each station or by each station and operator.
- Select a single point to see the individual observations represented by the point. If the point is a flagged point, you can also see the assignable causes, corrective actions, and comments.
- Select a range of points to see the summary statistics for the selected points. When in Edit mode (Edit Parameters), you can use these estimated parameters to update the center line and control limits, or you can provide the parameters if you have historical data.
Note
Control chart points with assignable causes are not used in the control limit calculations.
For more information on recalculating control limits from data or historical parameters, go to Use recent data to recalculate control limits.
Recent subgroups
- You can select a common numeric option, such as Last 25 subgroups.
- To specify the number of subgroups, use Last X subgroups.
- When you select All subgroups, the control chart displays the maximum number of subgroups per the global setting maximum. For more information on the maximum number of subgroups preferences, go to Display options.
Note
This option affects only the display of the control chart. Calculations of control limits and parameter estimates rely on all the data within the selected time frame.
Add descriptor markers to control charts
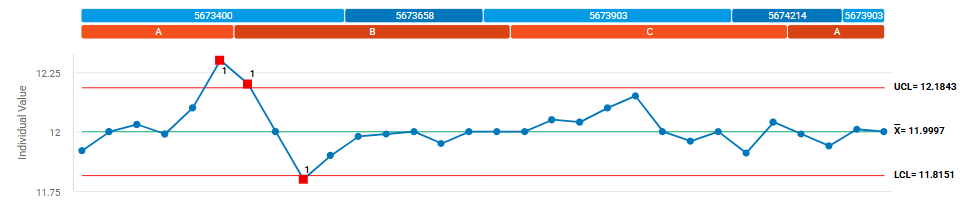
The subgroup descriptors of Lot Number and Shift Identifier have markers.
Capability Analysis
View capability analyses for the measures of the selected stations. Select the measure of interest and choose whether to view by each station, each station and operator, or a single analysis for all stations.
You can add confidence intervals for the capability indices for this analysis. Also, you can transform your data to fit a normal distribution to satisfy the assumptions for this analysis. To change the default display settings for all capability analyses, go to Capability analysis preferences.
Pareto Charts
- Assignable Causes
- View Pareto charts for assignable causes and corrective actions for the measures of the selected stations.
- Defect Types or Defective Types
- View Pareto charts for defect or defective types at the selected stations.
If you have many categories with small counts, you can set a percentage to combine these categories into a summary category called "Other".