Details
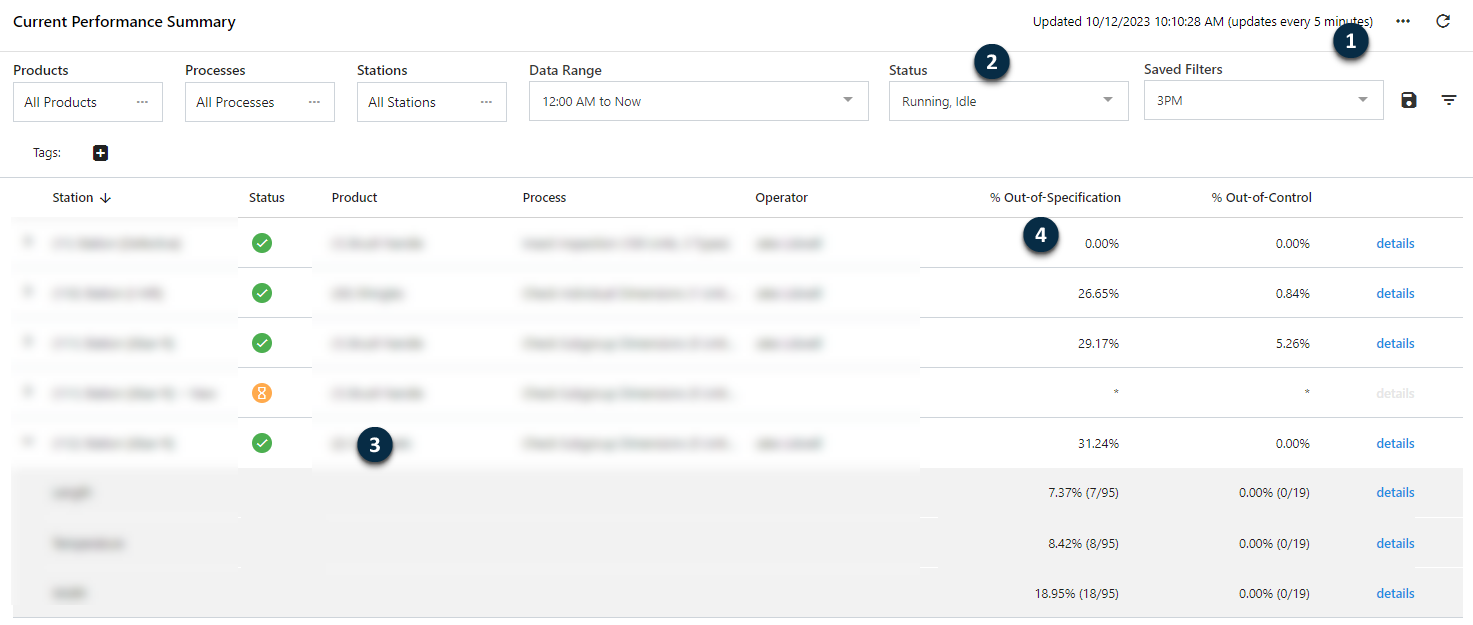
The Current Performance Summary consists of controls for refreshing and filtering data, tools for customizing the dashboard, and a table that displays station and measure performance metrics.
- 1: Refresh data
- Select the Refresh
 button to refresh
the station data. Use the Auto-update Settings
button to refresh
the station data. Use the Auto-update Settings
 button to change the
automatic refresh rate.
button to change the
automatic refresh rate. - 2: Filter settings
- Use the filter settings to control which stations and data appear in the
summary. You can select all products, processes, and stations, or only
the stations of interest. Also, specify the data range for this summary
as well as the station status.
You can save
 and manage
 the filter
settings.
the filter
settings. - 3: Manage and organize the dashboard columns
- Choose which columns to display and arrange their order. Once your dashboard is set up, you can save it as a filter setting.
- 4: Station identification information
- In the default view, stations are sorted by station performance. To rearrange, sort by the column of your choice.
- 5: Station performance information
- Displays quality metrics that summarize the percentage of observations or subgroups that are out of compliance at each station. Expand a station to view performance by individual measure. For more information on limits, go to Specification limits and Net content limits.
Understand the dashboard columns
Tip
Higher values in the out-of-specification, out-of-action, or out-of-control columns indicate increased risk and may require investigation. Use column sorting to quickly identify the poorest-performing stations.
- Station
- Identifies the station. Expand the station row to see all the measures within the station.
- Status
- Identifies whether the online station is Running, Idle, or Shutdown.
- Product
- Identifies the product made at the station.
- Process
- Identifies the process for the station.
- Operator
- Identifies the operators who recorded measurements during the specified time frame.
- % Out-of-Specification
- Displays the percentage of observations that are out-of-specification for each station. Expand the station to see the details for each measure.
- % Out-of-MAV
- Displays the percentage of observations that exceed the MAV net contents thresholds for each station. Expand the station to see the details for each measure.
- % Out-of-T2
- Displays the percentage of observations that exceed the T2 net contents thresholds for each station. Expand the station to see the details for each measure.
- % Btwn T1-T2
- Displays the percentage of observations that are between the T1 and T2 net contents thresholds for each station. Expand the station to see the details for each measure.
- % Out-of-T1
- Displays the percentage of observations that exceed the T1 net contents thresholds for each station. Expand the station to see the details for each measure.
- % Out-of-Action
- Displays the percentage of subgroups that are out-of-action for each station. Expand the station to see the details for each measure.
- % Out-of-Control
- Displays the percentage of subgroups that are out-of-control for each station. Expand the station to see the details for each measure.
- % Overfill
- Displays the percentage of product that exceeds the label stated contents for each measure. If the value is negative, then it represents the percentage of underfill.
- Label Stated Content (LSC)
- Displays the official weight, measure, or count of product contained within a package.
- Measure Averages
- Expand the station to see the average value for each measure.
- % Below LMAV
- Displays the percentage of observations that are below the Lower MAV (LMAV) threshold for each station. Expand the station to see the details for each measure.
- % Above UMAV
- Displays the percentage of observations that are above the Upper MAV (UMAV) threshold for each station. Expand the station to see the details for each measure.
- % Below Lower T2
- Displays the percentage of observations that fall below the lower T2 threshold for each station. Expand the station to see the details for each measure.
- % Above Upper T2
- Displays the percentage of observations that exceed the upper T2 threshold for each station. Expand the station to see the details for each measure.
- % Btwn Lower T1-T2
- Displays the percentage of observations that fall between the lower T1 and lower T2 thresholds for each station. Expand the station to see the details for each measure.
- % Btwn Upper T1-T2
- Displays the percentage of observations that fall between the upper T1 and upper T2 thresholds for each station. Expand the station to see the details for each measure.
Note
For more information on these calculations, go to Report calculations.
Organize dashboard columns
- Open Manage Columns.
- Select the columns to show. Deselect the columns to hide. The Station, Product, and Process columns cannot be hidden.
- Select the drag handles to rearrange the columns to your preferred order.
- Select OK.
Select the data range
Note
The maximum data range depends on how frequently data are archived. For more information, go to Data Management settings within the Administrator Portal.
- Daily Window
- Displays the data of the current day, beginning at the start time that you specify. By default, the data range is 12:00 AM to the current time.
- Last X Hours
- Displays up to 168 hours of recent data.
- Last X Days
- Displays up to 365 days of recent data.
- Fixed Date/Time Range
- Displays the current data between the start and end times that you specify.
Save and manage filters
Saving filters allows you to quickly return to frequently used dashboard views.
Complete the following steps to save your filter selections as a saved view.
- Select the products, processes, stations, start time, and station status.
- Use Manage Columns to select columns and arrange their order for your custom dashboard view. You can also sort by the column of your choice.
-
Select Save
.
- Enter a name for your new filter and decide whether to set as the default view.
- Select OK.
-
Select Manage Filters
to delete filters or set
a new default filter.