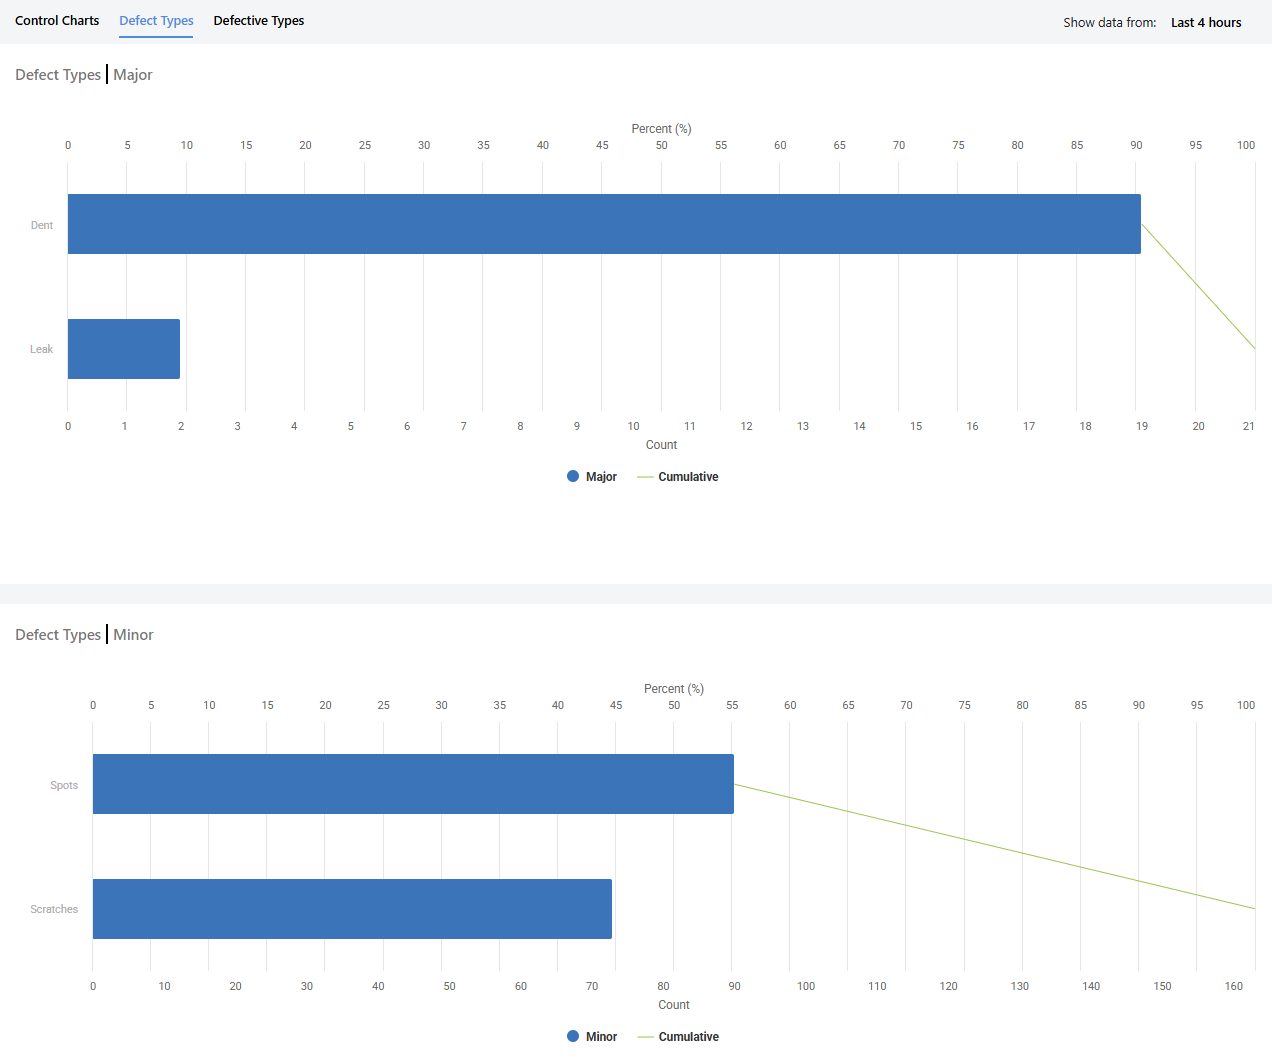
With Real-Time SPC, you can use Pareto charts to identify the most
frequent defects and defectives. Use Pareto charts to focus improvement efforts on areas
where the largest gains can be made.
Real-Time SPC creates a separate Pareto chart for each defect
severity.
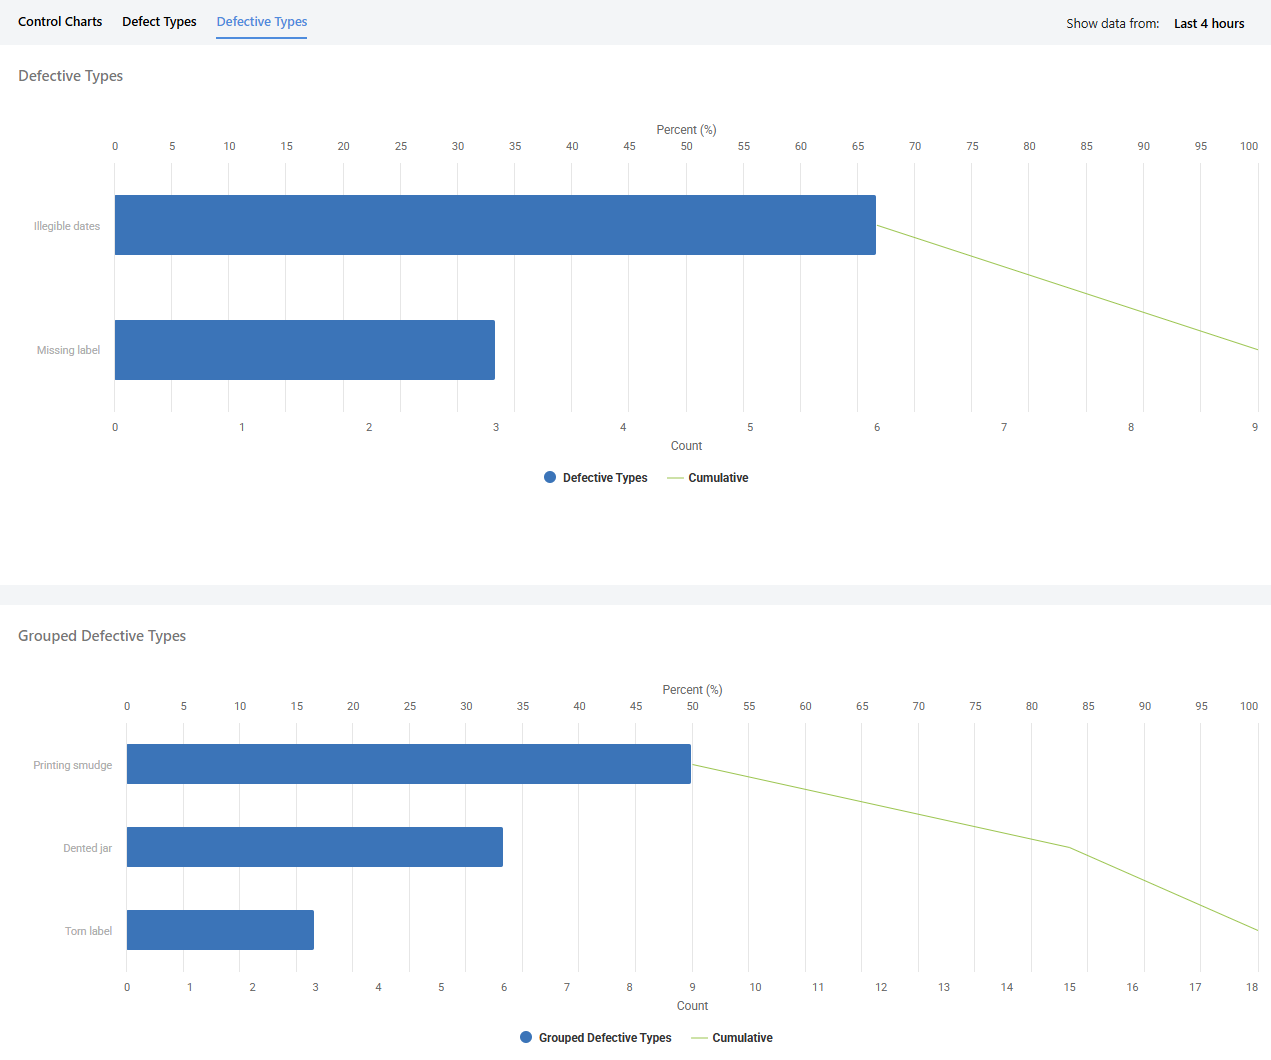
Real-Time SPC creates a separate Pareto chart for individual
defective types and grouped defective types.
Note
If you have a particular defective type that you want
to monitor separately, you must set it up as a defective measure. If you have
multiple defective types that you want to monitor together, you must set it up as a
grouped defective. For more information, go to Group quality attributes or monitor separately.