Data view tables are accessible from the station dashboard in the Data tab. Each row of data contains information on each observation and each subgroup. Key columns are sortable in ascending or descending order. Red rows indicate data that are out-of-specification.
- Individual observations
- Select the row and then select Edit Observation.
For individual observations, you can edit the data value, assignable causes, corrective actions, comments, and individual descriptors.
- Subgroups
- Select the row and then select Edit Subgroup.
For subgroups, you can edit assignable causes, corrective actions, comments, and subgroup descriptors.
You can also edit the data from the control chart view. For more information, go to Edit observations and descriptors.
Continuous data measures
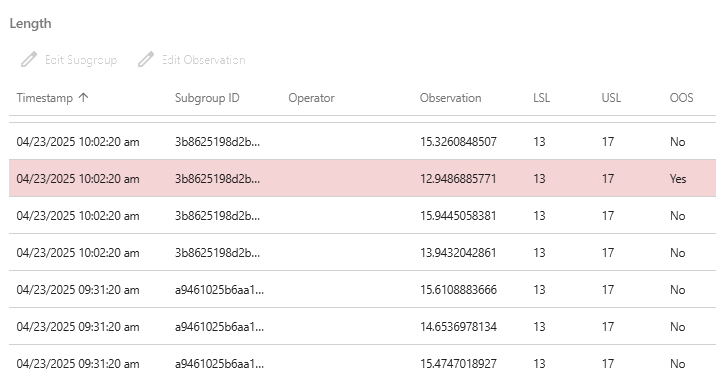
In this example, the data table displays the data for a process measure. The highlighted row indicates the observation is out-of-specification.
Defects
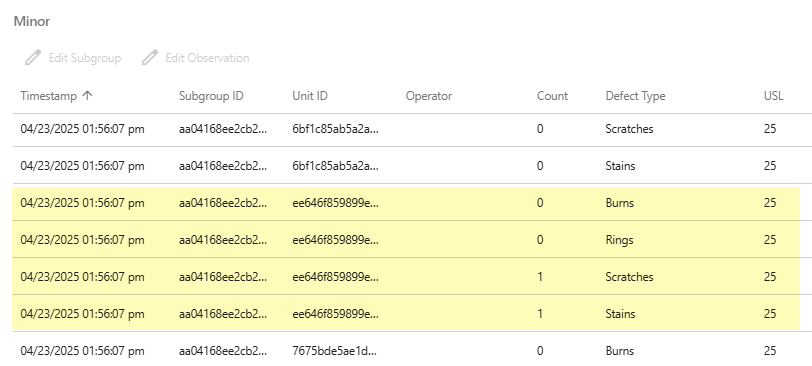
In this example, the data table displays the data for the Minor severity level. The highlighted rows are the same unit and are evaluated for Burns, Rings, Scratches, and Stains. This sampled item has 2 defects: 1 Scratch and 1 Stain, and no Burns and Rings.
Note
USL is defined as defects per unit for a U Chart and defect counts for a C Chart.
Defectives
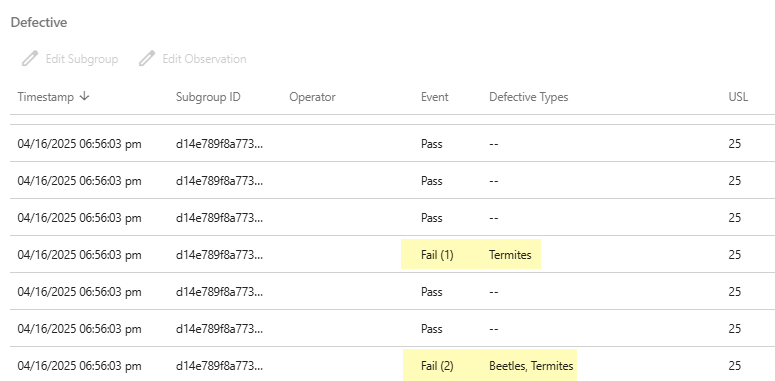
In this example, the data table displays the data for the grouped defectives. The highlighted rows indicate the number and type of defectives. The first highlighted item has one type of defective, Termites. The second highlighted item has two types of defectives, Beetles and Termites.
Note
USL is defined as proportion defective for a P Chart and defective counts for an NP Chart.