Estimation methods for standard deviation
This global setting sets the estimation method for each type of control chart. Select
Analysis
Preferences
![]() in the
Engineering portal, then navigate to Control
Charts.
in the
Engineering portal, then navigate to Control
Charts.
The available estimation methods depend on the type of control chart and the subgroup size.
| Control chart | Estimation methods |
|---|---|
| I-MR Chart |
|
| Xbar-R Chart |
|
| Xbar-S Chart |
|
| I-MR-R/S Chart | For between-subgroup standard deviation:
|
| EWMA Chart | When subgroup size > 1:
|
- Average moving range
- The average moving range is the average value of the moving range of two or more consecutive points. This method is commonly used when the subgroup size is 1.
- Median moving range
- The median moving range is the median value of the moving range of two or more consecutive points. This method is best to use when data have extreme ranges that could influence the moving range.
- Square root of MSSD
- The square root of MSSD is the square root of the mean of the squared differences between consecutive points. Use this method when you cannot reasonably assume that at least 2 consecutive points were collected under similar conditions.
- Length of moving range
- Enter the number of observations used to calculate the moving range. The length must be ≤ 100. The default length is 2 because consecutive values have the greatest chance of being alike.
- Use Nelson estimate
- Select this option to correct for unusually large moving range values in the calculation of the control limits.
- Rbar
- Rbar is the average of the subgroup ranges. This method is a common estimate of the standard deviation and works best with subgroup sizes from 2 to 8.
- Sbar
- Sbar is the average of the subgroup standard deviations. This method provides a more precise estimate of the standard deviation than Rbar, especially with subgroup sizes > 8.
- Pooled standard deviation
- The pooled standard deviation is the weighted average of subgroup variances, which gives larger subgroups more influence on the overall estimate. This method provides the most precise estimate of standard deviation when the process is in control.
- Use unbiasing constants
- Unbiasing constants reduce the bias that can occur when a parameter is estimated from a small number of observations. As the number of observations increases, unbiasing constants have less effect on the calculated results.
Tests for special causes
This global setting sets the default settings for each control chart test. Select
Analysis
Preferences
![]() in the
Engineering portal, then navigate to .
in the
Engineering portal, then navigate to .
Use the tests to determine which observations to investigate and to identify the specific patterns and trends in your data. By default, Real-Time SPC uses only Test 1. Select additional tests based on company or industry standards.
- Test 1: One point more than 3σ from center line
- Test 1 identifies subgroups that are unusual compared to other
subgroups. Test 1 is universally recognized as necessary for detecting
out-of-control situations. If small shifts in the process are of
interest, you can use Test 2 to supplement Test 1 in order to create a
control chart that has greater sensitivity.

- Test 2: Nine points in a row on the same side of the center line
- Test 2 identifies shifts in the process centering or variation. If
small shifts in the process are of interest, you can use Test 2 to
supplement Test 1 in order to create a control chart that has greater
sensitivity.
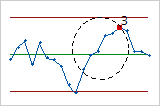
- Test 3: Six points in a row, all increasing or all decreasing
- Test 3 detects trends. This test looks for a long series of consecutive
points that consistently increase in value or decrease in value.
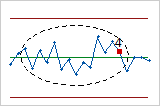
- Test 4: Fourteen points in a row, alternating up and down
- Test 4 detects systematic variation. You want the pattern of variation
in a process to be random, but a point that fails Test 4 might indicate
that the pattern of variation is predictable.
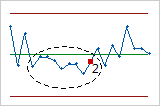
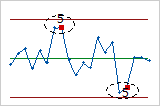
- Test 5: Two out of three points more than 2σ from the center line (same side)
- Test 5 detects small shifts in the process.
- Test 6: Four out of five points more than 1σ from center line (same side)
- Test 6 detects small shifts in the process.

- Test 7: Fifteen points in a row within 1σ of center line (either side)
- Test 7 detects a pattern of variation that is sometimes mistaken as
evidence of good control. This test detects control limits that are too
wide. Control limits that are too wide are often caused by stratified
data, which occur when a systematic source of variation is present
within each subgroup.

- Test 8: Eight points in a row more than 1σ from center line (either side)
- Test 8 detects a mixture pattern. In a mixture pattern, the points tend
to fall away from the center line and instead fall near the control
limits.

Control limit settings
This global setting sets the default settings for the calculation of control limits.
Select Analysis
Preferences
![]() in the
Engineering portal, then navigate to .
in the
Engineering portal, then navigate to .
For new control charts, the center line and control limits are calculated from the data. You can specify the moving data range for these calculations.
For continuous data, the default is 100 observations. For attribute data, the default is 25 subgroups. Change these settings if you want to include more or less data in the calculations.
After the center line and control limits of a control chart have been calculated, they are set and locked. These lines will remain until a new calculation is initiated. For more information on control limit options, go to Control limits.
Display options
This global setting sets the maximum number of subgroups that display on each control
chart. Select Analysis
Preferences
![]() in the
Engineering portal, then navigate to .
in the
Engineering portal, then navigate to .
When All subgroups is selected, the control chart displays the maximum number of subgroups per the global setting maximum.
Examples
- Scenario 1, recent subgroups
- Suppose you also use the following settings.
- Maximum number of subgroups to display = 250
- Most recent subgroup setting = Last 100 subgroups
- Scenario 2, all subgroups
- Now, suppose you use the following settings.
- Maximum number of subgroups to display = 250
- Most recent subgroup setting = All subgroups
For more information on other specific control chart display options, go to Control chart display options.