Add assignable causes, corrective actions, and comments to plotted points
- From the control chart on the Process Quality Snapshot or Station Dashboard, double-click the point to open the details pane.
- Select Edit for the plotted point, or for each individual observation.
- Enter relevant assignable causes, corrective actions, and comments, then select OK.
To display or suppress indicators of point annotations on the Station Dashboard, open the Settings
![]() and select
or deselect Show point annotations.
and select
or deselect Show point annotations.
Add descriptor markers to control charts
- Go to the Components page and select a product. Then select the process flow step of your product.
- Open the process step and go to the Descriptors section to access the categorical descriptors available with this product and process.
- Begin typing to add Product descriptor variables to this product and process. By default, Global descriptors have been added.
- Select Add Markers for a maximum of five subgroup descriptors that display on control charts in station dashboards.
- Save your changes.
The subgroup descriptors of Lot Number and Shift Identifier have markers.
Note
To display the markers on control charts in the Process Quality Snapshot, select descriptors from the Add Markers dropdown menu of the control chart. For more information about descriptors, go to Add descriptors.
Hide the display of control charts on the station dashboard
Engineers can hide control charts by measure on the station dashboard. This setting is on the Components page in the process step on the product. For each control chart, you can display all the charts, only the first chart, or no charts. For more information, go to Control chart settings for each measure, then select Display on station dashboard.
This setting affects only the display on the station dashboard. All charts for the selected control chart display on the Process Quality Snapshot.
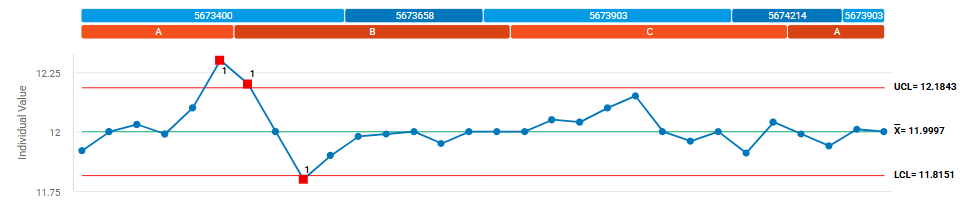
Show failed tests of plotted points
Note
Failed test numbers always display on the Process Quality Snapshot.
Specify additional limits to display
Control charts always display the control limits unless you configure the control chart to not use control limits. For more information, go to Display on station dashboard.
You can choose whether to display or suppress the action limits and the specification limits on the control charts of the Station Dashboard. Any specified limits always display on the Process Quality Snapshot.
Note
Specification limits apply only to individual observations of continuous measures and subgroups of attribute measures. Thus, specification limits can only be displayed on I-MR charts and attribute charts.
Specify the x-axis label
- Process Quality Snapshot
- Select the
 icon, then select Advanced
options to select Date/Time or Index. The x-axis label applies to all the control charts in the station.
icon, then select Advanced
options to select Date/Time or Index. The x-axis label applies to all the control charts in the station. - Station Dashboard
- Open the Settings
 to select or deselect Show Date/Time to show either a timestamp or an index value.